Yeast pitching by weight

For a while now I have been tracking yeast propagation data in a big spread sheet. But not every yeast propagation gets logged in there since I don’t always bother about taking cell counts.

However, I do have a few data points that are of interest when it comes to pitching yeast by weight and calculating starter volumes. The latter I’ll save for another day.

The idea of pitching by weight relies on having reasonably accurate idea of the cell count per gram of yeast slurry. With this the cell count can be estimated from the yeast slurry’s weight. Weighing of propagated yeast is simple if you know the weight of the propagation vessel (for most brewers that will be an Erlenmeyer flask). It’s a good idea to mark the empty weight on the flask. You should also note the weight of the stir bar if you are using one. You should stir your starters.
Simply decant the spent starter beer until left with yeast sediment and stir bar. This works best with strains that floculate well. Weissbier yeast, for example doesn’t settle into a dense sediment and you’ll loose some slurry during decanting or have to leave a fair amount of starter beer in the sediment.

Then weigh the flask, subtract flask and stir bar weight and you have the yeast sediment weight.

That also works for washed yeast. If you don’t wash yeast and want to use the yeast sediment from a primary, turn the carboy upside down and let the yeast drip into a sanitized cup or beaker.

But how much yeast is in that sediment?

Here is some data I have:

  • freshly propagated WLP 830 sediment contains about 4.5 Billion cells per gram. I have 4 data points ranging from 4.0 to 4.9 B/g. My starters have very little trub since I use leftover wort that has already been boiled for 60+ min
  • harvested WLP 830 contains about 2.5 Billion cells per gram. I don’t get much trub into the fermenter. Virtually no hot break and maybe 50% of the cold break.
  • I have only two data points for freshly propagated WLP 833. The average is 3.8 B/g. This can safely be rounded up to 4 B/g
  • WLP 001 and WY 1272, both American Ale type yeasts, showed about 2.5 B/g in freshly propagated yeast sediment. These yeasts flocculate well and the sediment was as dense as the sediment for WLP 830/833. The yeast cells might just be a bit bigger than lager yeasts. I haven’t compared them under the microscope.
  • The only top crop data I have is for WY1272 and that showed 2.7 B/g, which is close to the freshly propagated sediment. I would expect that washed yeast sediment has about the same density.

That’s all the reliable data I have. I have used English ale yeast (WLP 002), but that one flocculates so strongly that I was not able to count yeast cells.

The little data I have suggests that clean lager yeast sediment contains almost twice the number of yeast cells than comparable ale yeast sediment and that harvested sediment has about 60% the cell count of clean sediment.

Feel free to use these numbers as guidelines and keep in mind that being off from the actual yeast count by +/- 25% should not be a big deal. Most pitching rate experiments where brewers evaluated under and over pitching where done with 0.5x, 1x and 2x the recommended pitching rate or an even greater spread.

If you have sediment density data of your own, that you are willing to share, feel free to do so.

patent pending brewing process for Infinium

Infinium is collaboration between the Boston Beer Company and Weihenstephan brewery in Freising Germany. I had the beer once at a club meeting and didn’t think it was all that special. What interested me more, though, was the novel brewing process for which Boston Beer filed a patent application.

The problem in making a light high alcohol beer that complies with the German Purity Law (Reinheitsgebot) is that it has to be made from all malt and can’t use sugar to increase alcohol without adding body. Normal brewing procedures, even if aimed at high fermebtability, leave too much dextrins which would add too much body to the beer.

After not being able to find the patent or application on my own I asked around in my brewing club, with success:

United States Patent Application 20110274785 – METHOD AND SYSTEM FOR PRODUCING A MALT BEVERAGE HAVING A HIGH DEGREE OF FERMENTATION

The wort is brewed with a stepped mash that isn’t out of the ordinary. The patent application mentions long (150 min) rest at 63 C before a mash -out at 72 C is done. This will already produce a highly fermentable wort. Key to even higher fermentability, however, is the preparation of an enzyme rich solution from what they call “green” malt.  “green” malt, also known as air-malt is malt that has been germinated and dried, but not kilned. The absence of high temperatures ensures that it is extremely rich in enzymes.

The enzyme rich extract is prepared my mashing the green malt at 57 C to preserve limit detxtrinase and b-amylase. The temperature is high enough to kill most micro organisms. The resulting supernatant can be added to the 65 C first wort in the kettle where the enzymes are able to continue to break down dextrines that were not broken down in the mash.

This by itself does not yet lead to a satisfactory fermentability and 24 hrs after the addition of the yeast another green malt mash is prepared. This time the supernatant is added to the fermenting beer where it is able to break down more residual dextrines w/o the enzyme life being cut short by the head of a mash or a boil. The patent appilication claims that all these processes can lead to a beer with an attenuation of 96%.

While this process seems fairly ingenious, a number of similar patents have already been issued. A simple patent search for “low calorie beer”, the main application for enzyme additions in brewing, lead me to this old Anheuser Bush patent:

United States Patent 4,272,552 – Process for producing a low carbohydrate, low calorie beer

It also talks about adding the enzyme rich supernatant from a secondary mash to fermenting beer in oder to lower residual extract or boost fermentation. The key difference to Boston Beer’s patent application is the use of green malt by Boston Beer. But I don’t think that this is all that crucial and that an Infinium like beer can easily be brewed without green malt.

In addition to that at what drying temperature is malt no more “green” malt but kilned malt?

The effect of zinc on fermentation performance

This is the 2nd series of experiments regarding the effects of various additives and fermentation conditions on fermentation performance and beer quality. This time I wanted to take a closer look at the impact of various levels of zinc additions on fermentation performance.

Zinc is an important co-factor in many enzymes and thus a requirement for yeast growth. Most yeast strains require 0.1 – 0.2 mg/l of zinc. Zinc levels greater than 0.6 mg/l can inhibit yeast growth (Priest, Handbook of Brewing).

Zinc may be the only yeast nutrient that even barley malt is deficient of. As a result fermentation performance may benefit from the addition of zinc. This is why I conducted this experiment.

In the end I was not able to find any significant difference between the control fermentation and the 4 different levels of zinc additions with the exception of yeast growth. The most yeast growth was observed for the fermentation that added 0.2 mg/l zinc. This would agree with the literature which mentions possible yeast growth inhibition at total zinc levels above 0.6 mg/l.

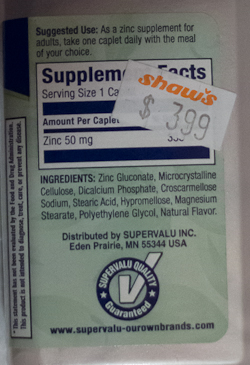
The absence of other differences may be because the wort (98% Pilsner malt wort) contained sufficient zinc for the yeast that was used (WLP 830) or that the yeast was not able to utilize the zinc that was added (in this case the yeast growth differences would have to be attributed to a random error). The zinc came from simple 50 mg zinc tablets that are available as dietary supplements in a grocery store.

Details of the experiment

The wort that was used was left over from a Pilsner brewed with

  • 96% Best Pilsner Malt
  • 2% Weyermann Sauermalz
  • 1% Weyermann CaraMunich I
  • 1% Weyermann CaraPils

Mashed with a Hochkurz mash

  • 30 min at 65C
  • 45 min at 72 C
  • 15 min mash-out

moderately hopped with FWH Saaz and 60 min boil addition of hop extract

It was boiled and cooled before a stir plate and O2 were used to achieve a wort oxygen content of ~12 ppm. WLP 830 yeast was then added and allowed to un-flocculate completely before the pitching rate was determined with a hemocytometer. The pitching rate was about 9 Millon cells per ml.

About 413-125g of this pitched wort were poured into 5 500 ml Erlenmeyer flasks. In order to eliminate the effects of settling yeast during this process flasks were filled in random order and the cell density in the remaining wort was also determined. That cell density was around 10 M/ml. As a result there was no significant yeast settling that may have lead to different pitching rates.

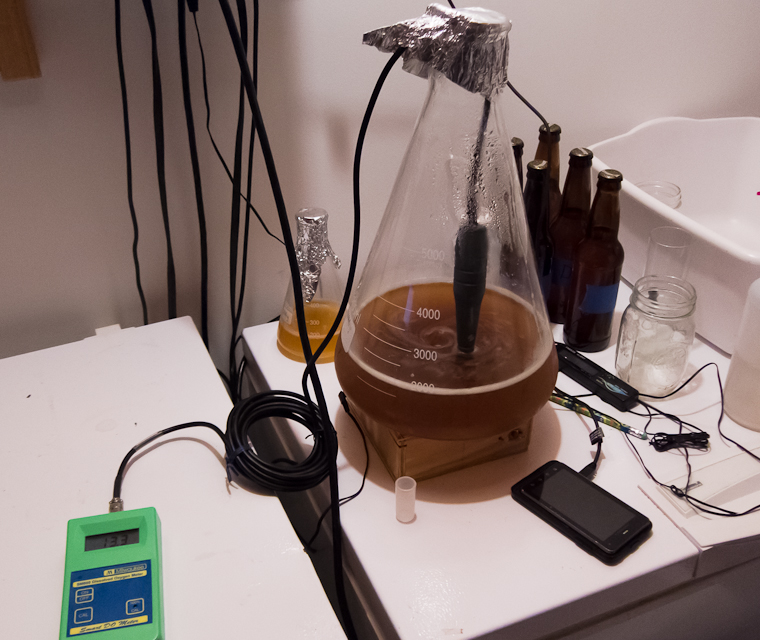
Wort oxygenation while the oxygen content is monitored with a dissolved oxygen meter

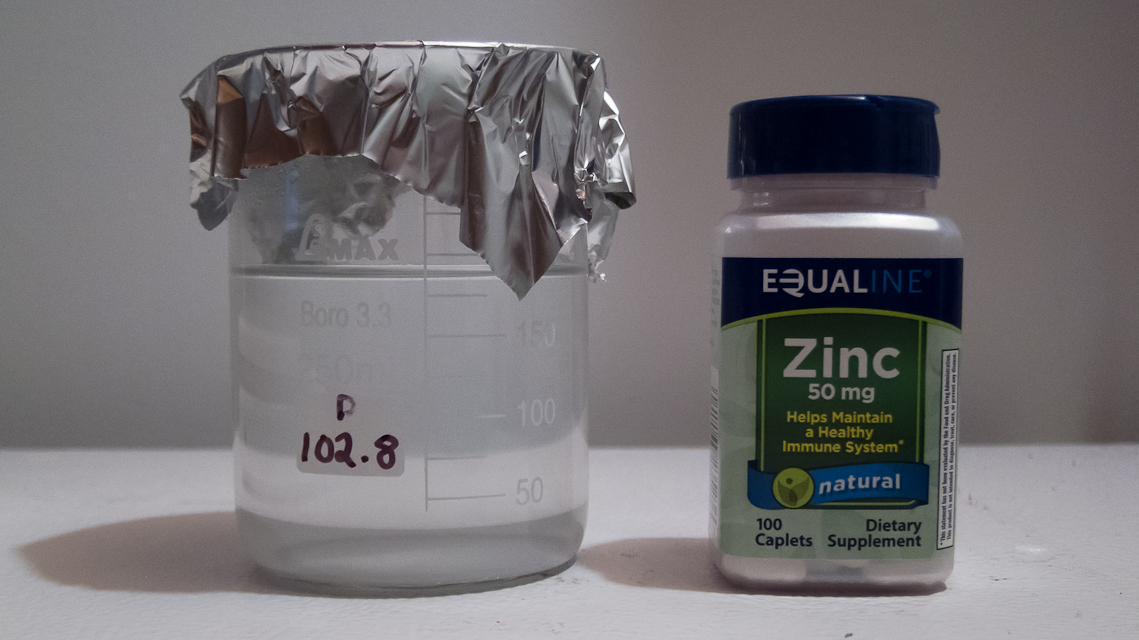
To provide varying levels of zinc additions a 50 mg zinc tablet was dissolved in 185 ml water resulting in a 0.27 mg/ml solution. 0, 0.3, 1, 4 and 8 ml of this solution were added to the 5 different fermentation resulting in 0.0, 0.2, 0.7, 2.6 and 5.1 mg/l of zinc addition, respectively. To keep the addition of water the same DI water was added such that the water addition was 8 ml for each fermentation.

Zinc solution and Zinc tablets

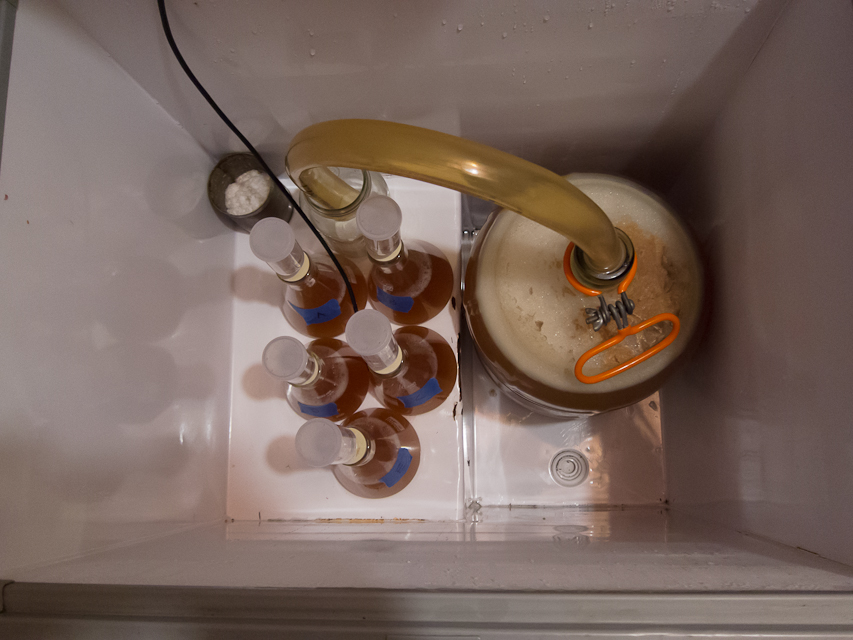
The flasks were sealed with an airlock and their initial weight was determined before they were placed into a temperature controlled freezer chest. The initial ambient temperature was 7.5 C and was later raised to 11.8 C.

All five flasks in the freezer chest with the temperature probe in their middle

The flasks were weighed about twice per day for 15 days until the weight loss stabilized. At that point the extract content of the beer was determined with a precision 0.990 – 1.020 sg hydrometer before the beer was filled into a bottle along with 1.9 g of sugar and some of the yeast sediment.

The yeast sediment remaining in each flask after all beer was decanted was determined by weighing the flask and subtracting the empty weight of the flask.

About 1 oz of beer was left over which used to measure pH and these samples were also tasted.

These are the various metrics that were collected for all 5 fermentations:

test name A B C D E
zinc added 0.0 0.2 0.7 2.6 5.1 mg/l
stating extract 11.6 Plato
attenuation limit 78.4% ADF
yeast strain WLP830
yeast source Pils Fast Ferment Test sediment

yeast age 1 day
fermentation type still, airlock
starting O2 12.4 mg/l
pitching rate 9 M/ml
fill order 1 5 4 3 2
extract drop per day 1) 1.3 1.3 1.3 1.3 1.3 Plato
final extract 2.8 2.8 2.8 2.8 2.8 Plato
ADF 75.9% 75.9% 75.9% 75.9% 75.9%
attenuation delta 2.5% 2.5% 2.5% 2.5% 2.5%
yeast sediment weight 8.0 9.0 8.3 7.7 7.2 g
pH 4.50 4.55 4.55 4.55 4.53

1) refers to the extract loss per day during the most intense part of the fermentation and was determined from the slope in the fermentation profile

And the fermentation profile:

fermentation profile as percent weight loss over time

For some reason the “+8 mg/l Zn” fermentation showed a larger weight loss (measure of lost CO2) then the other fermentations, but that did not show up as higher attenuation or lower final extract. It is not known what could have caused this increased weight loss.

The fermentation metrics for all 4 beers are very much the same. The most yeast growth was achieved for the “+0.3 mg/l Zn” fermentation, while higher additions led to less yeast growth. This might be an result of total wort zinc levels in excess of 0.6 mg/l which is known to inhibit yeast growth. This yeast growth inhibition did not affect other fermentation parameters like extract drop per day during the most intense part of fermentation.

There were no taste differences that I detected between the beers. Tasting of samples was done after the measurements were taken and my taste perception could have been influenced by my expectation that there would be no difference.

It is possible that the zinc had no effect and that the yeast sediment weight differences are the result of a random error. On the left is a picture of the ingredients label. Zinc is present in these caplets as Zinc Gluconate which may not readily release Zn2+ into the wort. The use of zinc chloride would have been more reliable, but I didn’t have that at hand. Maybe for a later experiment I get ZnCl2.

Pitching Rate Experiment – Tasting

After about a week of being carbonated at room temperature and a few days in the fridge I tasted the beers fermented with different pitching rates. All beers carbonated well.

But first a few stats that I also collected: pH an foam stability. Below in bold:


test name A B D C E

stating extract 13.1 Plato
attenuation limit 80.0%

yeast strain WLP830 from slant

yeast source Bo Pils FFT

yeast age 2 days
fermentation type still, airlock, in 500ml flask

fermentation temp 18 C
starting O2 7.2 mg/l
pitching rate 32 23 15 9 2 M/ml
extract drop per day 1) 3.5 3.7 3.7 3.0 2.8 Plato
final extract 2.7 2.7 2.7 2.8 2.9 Plato
attenuation delta 0.6% 0.6% 0.6% 1.4% 2.1%

yeast growth 36.0 30.7 37.5 33.9 29.3 B
growth per extract 0.77 0.66 0.81 0.72 0.63 B/g
pH 4.28 4.37 4.50 4.43 4.60

foam 7:06 12+ 11:20 12+ 10:25 min

The pH of the beer behaved as expected: The more aggressive the fermentation the larger the pH drop and the beer with the most aggressive fermentation was the one with the highest pitching rate. I was a bit surprised by the magnitude of the beer pH difference.

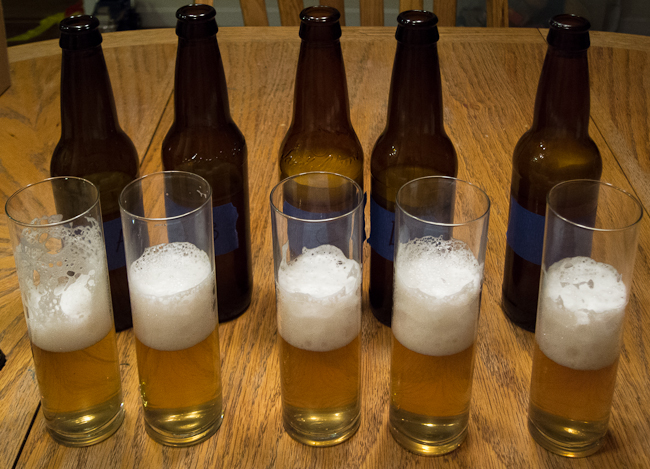
Foam stability is where I pour the beer straight into a Koelsch glass until the foam reaches the top and then I measure the time it takes for the layer of bubbles to collapse, break and reveal the surface of the beer. These numbers are not very repeatable and can be very random. Everything above 7 min is pretty good. The test is designed to detect major deficiencies in foam stability.

The 5 beers a few minutes into the foam stability test

The 5 beers a few minutes into the foam stability test

As for the taste differences, all beers tasted very similar. I did the tasting knowing which beer was which and it appeared to me that beer A, the one with the highest pitching rate, had a more estery taste and aroma than beer E, the one with the lower pitching rate. The lowest pitching rate beer seemed to have the cleanest aroma but also appeared more bitter and exhibited a thinner mouthfeel.

The literature reports that ester production is connected with yeast growth and the more the yeast is able to grow the less it will produce esters since the ester precursor Acyl CoA is used for yeast growth. However, the amount of yeast sediment produced by each fermentation suggested that the most yeast growth happened for the beer with the highest pitching rate.

In the end, this is just another data point for the effects of pitching rate on fermentation performance and beer quality.

Kai

Pitching Rate Experiment

I finally got around to conduct a new set of experiments. These experiments focus on fermentation. Rather than brewing full batches of beer and change parameters I’m using wort left over from full size batches to run a few small scale fermentation experiments.

The first set of experiments focused on pitching rate. Since pitching rate is a parameter that has been evaluated by many brewers I didn’t expect too many surprises. I was mostly interested in testing my approach, in particular using the weight change of the fermenting beer as an indicator of the progression of fermentation. This weight drop is the result of escaping CO2.

300 ml of 12 Plato beer contain about 36g of extract. With an apparent attenuation limit of 80% about 66% or 23.8g of this extract is fermentable. About 1/2 of its weight is converted to CO2 of which the majority escapes. This means during fermentation the beer looses about 11g or 4% of its weight. This weight loss can easily be followed using a scale with an accuracy of 0.1 g. The scale I use is a cheap kitchen type scale with a capacity of 2 kg and a precision of 0.1g. It has shown excellent repeatability of weight measurements.

Setup

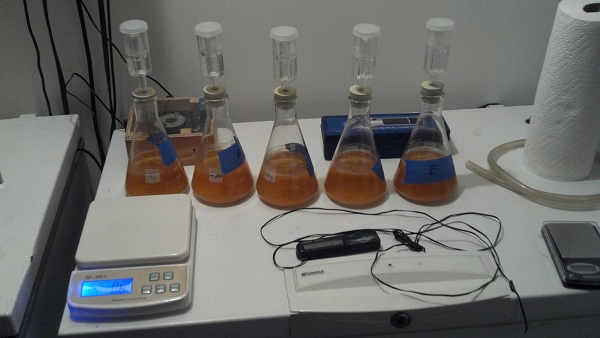
For this experiment WLP 830 yeast sediment from a fast ferment test was added in different amounts to about 355g of 13.1 Plato Pilsner wort. The wort was aerated to about 7.2 ppm O2 before it was divided into the individual 500 ml flasks for the experiment. The yeast was brought into suspension and pitching rates were determined though cell counts.

The beer was not agitated during fermentation and the flasks were closed with an airlock. The mean ambient fermentation temperature was 18 C. Weight measurements were taken twice daily. After 7 1/2 days, once the weight stabilized and approached the expected weight loss, the extract was measured using a hydrometer and the beer was filled into individual 12 oz bottles. Sugar syrup and some yeast was added to carbonate the beers.

To asses the level of yeast growth that happened during fermentation all beer was decanted from the flask and the flask with sediment was weighed. The empty weight of all flasks used was known and hence the weight of sediment could be determined. To estimate cell count a sediment density of 4 Billion cells per gram was assumed. This is a number that I found true for yeast sediments from fast ferment tests or yeast propagation.

Results


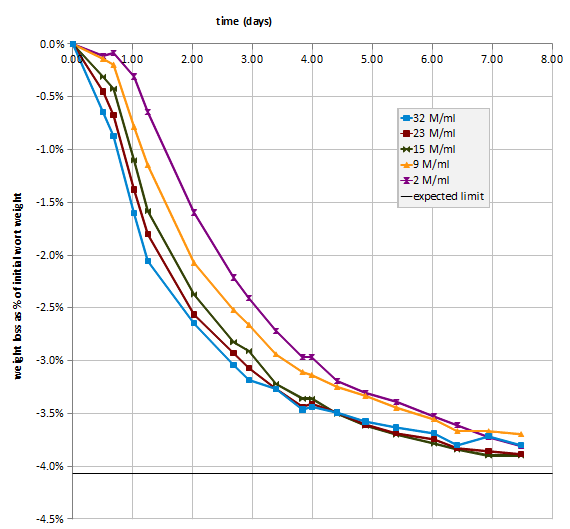
The following chart shows the beer’s weight drop (in %) during fermentation for all 5 pitching rates:

The following table shows metrics that were measured

test name A B D C E
stating extract 13.1 Plato
attenuation limit 80.0%
yeast strain WLP830 from slant
yeast source Bo Pils FFT
yeast age 2 days
fermentation type still, airlock, in 500ml flask
fermentation temp 18 C
starting O2 7.2 mg/l
pitching rate 32 23 15 9 2 M/ml
extract drop per day 1) 3.5 3.7 3.7 3.0 2.8 Plato
final extract 2.7 2.7 2.7 2.8 2.9 Plato
attenuation delta 2)
0.6% 0.6% 0.6% 1.4% 2.1%
yeast growth 36.0 30.7 37.5 33.9 29.3 B
growth per extract 0.77 0.66 0.81 0.72 0.63 B/g

1) the extract drop per day was for the most active part of the fermentation

2) difference between limit of attenuation and actual attenuation

Discussion

The progression of the extract or weight drop during fermentation was as expected: The higher the pitching rate the faster the fermentation start and the greater the extract drop during the most active part of fermentation. This has been observed before and is related to the greater initial yeast population.

It is also well known that beers with lower pitching rates have a more difficult time or take longer to attenuate fully. This was observed as a higher final extract for the beers with the lowest pitching rates compared to the beers with higher initial pitching rates. The differences were not very dramatic, though.

The amount of yeast growth showed a correlation to pitching rate. Higher pitching rates lead to more yeast growth (the initial cell population was considered in this analysis) but the differences in yeast growth were not large. The highest pitching rate yielded about 25% more yeast growth. This might be due to the fact that yeast growth was limited by sterol reserves. A large initial population has more combined sterol reserves than a small initial population which means that it can sustain more cell divisions.

I have not yet tasted the finished beer and also plan to measure the pH of each of these beers at that point.

Beer color to mash pH (v2.0)

I finally completed an article than I promised when I wrote the Sep/Oct 2011 Zymurgy article on mash pH and beer color: Beer color to mash pH (v2.0). Don’t get too excited, though. This is very heavy on math and should merely be seen as a reference to how I arrived at the current SRM to mash pH formula I implemented in the most recent versions of Kaiser_water_calculator_US_units.xls and Kaiser_water_calculator.xls.

File:SRM to mash pH formula 22.gif

and

File:SRM_to_mash_pH_formula_24.gif

Yeast propagation experiment

I finally ran a brewing experiment again and am dusting off this blog to post the results.

The experiment was a repeat of a standard experiment that evaluates yeast growth in still, intermittently shaken and stirred starters. I like how easy it is to set up and plan to repeat it again.

Setup

919g of 12 Plato wort were aerated to 100% air saturation on a stir plate. Then 7.8 g WLP 830 yeast sediment from a primary fermentation was added and allowed to un-flocculate completely. The cell density was determined as 22.3 Million/ml with a hemacytometer. If you do the math you find that the slurry contained a total of about 20 Billion cells which means its density was 2.63 Billion/g. Previous slurry density assessments for slurries from yeast propagation ranged from 4-5 Billion/g for this yeast. I assume that trub played a big role in the reduced cell count in this slurry.

Once the yeast was evenly distributed in the wort, the wort was evenly divided into 3 500 ml Erlenmeyer flasks. The flasks were labeled with their empty weight and covered tightly with aluminum foil. I didn’t tighten the cover intentionally. I noticed that this happens when I grab the flasks at their neck to shake them. I made sure that all of them had tightened aluminum foil caps, even though only one would be shaken intermittently.

All starters were allowed to complete fermentation. One sat still, one was shaken intermittently (1-2 times in the morning and 3-5 times in the evening) the last one was placed on a stir plate and stirred continuously. A vortex formed on the stir plate, but was eventually covered with foam when CO2 started escaping. The ambient temperature was around 18 C.

Data:

Once fermentation was complete the yeast was allowed to settle into a dense cake until the beer on top cleared. The beer was poured off and the flask’s weight with yeast and stir bar (in one of the flasks) was determined. From that, the empty weight and the stir bar weight the yeast weight was determined:

starter type total extract in starter (g) final yeast weight (g) estimated sugar utilization (Billion cells per g)
still 36 10.8 1.4
intermittent shaking 37 10.2 1.3
stirred 37 13.1 1.7

I only recorded the yeast weight and did not count the yeast with the microscope. Simply, because I did not want to spend too much time on this. To estimate the number of cells grown I assumed that the sediment had a density of 4.7 Billion/g, an average of the numbers I had assessed in earlier experiments.

Discussion and Conclusion:

The wort volumes for the three starters were not exactly the same, hence the difference in the extract weight.

I was surprised to see that the sill and shaken starters showed no difference in the amount of yeast that was gown from the available extract. This is different from the data reported by others (e.g. the great Maltose Falcon article on yeast propagation: Yeast Propagation and Maintenance: Principles and Practices) where a shaken starter grew significantly more than a still starter and a stirred starter outperformed a shaken starter by about 4x. The caption to the chart mentions that the data point for the still starter was taken from a different experiment, though.

Data I recorded on past yeast propagation steps (usually stirred)  and fast ferment tests (usually shaken) show more difference in extract utilization for yeast growth, but there are also a number of other parameters that have been different for those experiments. Most notably the starting gravity and the initial cell density.

I’ll have to repeat this experiment in the future to see what covering loosely with aluminum foil does and what an airlock would do to the extract utilization that can be achieved. And maybe I also find the time to count the final number of cells.

Does gelatenized starch contribute to the measured mash extract content?

This is a question I was not able to answer in a recent BBR interview: Do the starches, that are present in wort but are not converted yet, contribute to the extract content that is measured with a refractometer?

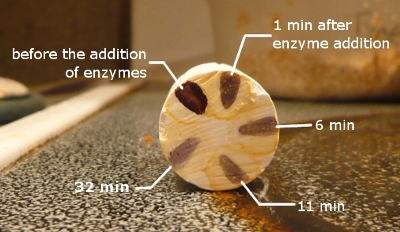
So I set out to test this in a quick experiment. I mixed 6.5 g corn starch with 116 g water and heated that in the microwave until it boiled. The result was a gooey mass of gelatinized starch. When I tested this paste with the refractometer the line was very blurry around about 5 Brix. The total starch content was 5.3 % by weight. Based on that it seems that gelatinized starch does change the refractive index of a solution.

flitering the cold mash to obtain amylase enzymes but no additional starch

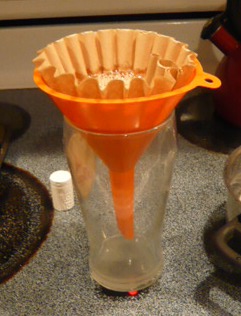
To get this solution more liquid and a clearer refractometer reading I had to add amylase enzymes. The easiest way to get them for a brewer is to make a cold malt extract. This means making a cold water mash and filtering it. The resulting wort had a extract content of about 1.6 Plato and I added 76g of this wort to the gooey starch mass which lowered its temp to ~60 C. Almost instantly the viscosity dropped and the solution became liquid.

If you do the math the resulting solution contains has about 3.8 % w/w solids. Immediately after mixing the solution tested at 3.2 Brix but 6 min later it tested at 3.6 Brix, which is about 3.7-3.8 Plato and close enough to the expected extract content while still showing a positive, albeit reduced, iodine reaction. I did not wait for the iodine reaction to completely disappear.

iodine test results after different rest times

This experiment shows that gelatinized starch also contributes to the mash extract that is measured with a refractometer.

The difference to an actual mash is that in an actual mash not all the starch is pulverized and immediately mixed with all the mash water as it was in this experiment. A lot of starch is inside grit particles and it takes time for this starch to be released into the sweet wort or to be converted inside the grit particles and for the resulting sugars and dextrins to diffuse into the wort. The starch present in the wort is converted within 20-30 min but there is a continued release of sugars into the wort which causes the increase in mash extract content that can be seen even after the iodine test is negative.

Brewing water spreadsheet update

I decided to give my brewing water calculator a face lift and also add some new features that brewers were looking for. The face lift happened mostly on the “basic” page, which is now more intuitively grouped into the sections for

  • base water
  • mash and grist info
  • salts and acids
  • resulting water profile and mash pH prediction

These are other things I changed or added:

  • changed the treatment of undissolved chalk such that it only contributes half its calcium since it contributes only half its alkalinity. Chalk’s solubility in mash seems to be limited and what does not dissolve and contribute to a rise in alkalinity should not contribute calcium ions either.
  • salt additions can now be made in g and mg/l. You can select the unit
  • the salts to be added can be reported in g and tsp. The latter is useful if your scale breaks down or you don’t own one yet.
  • lactic acid and phosphoric acid are supported. Are there many brewers who are actually using hydrochloric or sulfuric acid? I may add support for those later.
  • water boiling for alkalinity reduction has been added to the “advanced page”. This was easy to add since I already supported lime treatment
  • pH shift estimation for the major water treatment steps
  • salts can be added to all the water or strike water only. If they are only added to the strike water, the resulting water profile for the strike water or the overall water can be reported.

But a number of features remained the same:

  • The basic and advanced pages are still there. Anything entered in the basic page will automatically carry over into the advanced page. The idea is to support a wide variety of users.
  • the tall and narrow formatting remained in order to better support its use on mobile devices
  • I avoided macros or the use of fancy functionality in hope that this spreadsheet can be supported by mobile devices
  • the SRM based mash pH prediction is still there. Compared to some tests I’m running with grist based mash pH prediction, it does surprisingly well and is actually more accurate in most cases.
  • support for SI and US units. Under the hood it uses SI units almost exclusively. There is a spreadsheet version that is preloaded with US units even though this changes only 2 fields.

The new Kaiser_water_calculator.xls can be found in the Ingredients section on my site.

If you find bugs or have suggestions for improvements let me know here or send e-mail to “kai at braukaiser dot com”.

About pH Targets and Temperature

I noticed that the topic “At what temperature should mash pH be measured” comes up once in a while.  Just recently I had an e-mail and an on-line discussion with a fellow home brewers on the same subject.

Fact is that the pH of a solution changes with temperature. It is caused by a change of the dissociation constants of the various acids/bases that are in the solution. Even water is considered an acid since it can donate hydrogen ions, although in most cases it is not dominating pH at all. The extent of the change depends on the substance. By the same mechanism even the pH optimum of enzymes may shift with temperature it is also dependent on the ionization state of the acids in the protein. I believe that the 0.35 correction factor for mash temp (65 C) vs. room temp (25 C) pH contains both the aspect that the actual pH in the mash is lower at 65 C compared to 25 C and that the pH optimum of the amylase enzymes shifts a bit from the value that can be observed by room temperature mashing.

But none of this matters since by convention pH values in brewing are reported as the pH of a room temperature sample. This arises from the laboratory practice of cooling pH samples before pH is tested. While pH meters can correct for temperature and their probes may be able to withstand higher sample temperatures, testing only cooled sample extends the life of the probe. This common practice also means that reported pH optima and pH ranges are for room temperature samples even though the actual reaction happens at higher temperatures. A.J. deLange mentioned to me the “by convention” aspect which is an important argument in this discussion. “By convention” means that we could do it differently but we settled on this particular method in order to communicate our observations and recommendations more clearly.  Just as an example, another brewing measurement where we have a convention is the expressing the extract content in specific gravity. Rather than Plato, which measures the extract content by weight and which is something that doesn’t change with temperature, specific gravity does change with temperature and we assume that all those measurements are corrected for temperature such that they apply to a 68 F sample. The practice is and should be done for pH measurements. To be exact you’ll have to cool hot samples and warm cold (e.g. beer) samples.

It’s also helpful to take into account how we arrived at these pH optima/ranges. They are determined by conducting a series of mashes (at correct mash temp for that enzyme) with differing pH. The pH is tested in a room temp sample. The amount of product produced during these reactions (sugar, for example) is then plotted over this room temperature pH.

The same is true with boil pH recommendations where kettle boils at different pH values were done to determine how wort quality changes when the boil pH changes.

One problem is that hardly any author is explicit about this. I assume that most of them see it as a given that they talk about pH from room temperature samples. Briggs was the only one I found that made a distinction. This lack of explicitness, if this is a word, seems to cause a lot of confusion with home brewers.

As for the origin of this confusion, I believe that early home brewing literature and publications are to blame. John Palmer’s 1st edition of “How to Brew” states this:
“When you mash 100% base malt grist with distilled water, you will usually get a mash pH between 5.7-5.8. (Remember, the target is 5.1-5.5 pH.)”

In this sentence he mixes room temp and mash temp pH values. The 5.7-5.8 base malt pH is correct when seen as the pH of a room temperature mash sample while the 5.1-5.5 pH target is only correct when seen as a mash temp pH target with a conversion factor of 0.35. With the correction the room temp sample pH target range is 5.45 – 5.85, which is more correct.

The pH optima that John cites for various enzymes seem to be mash temp pH values. He doesn’t quote a source but the only source that I found which lists mash temp pH values is Briggs’s Brewing Practice and Science book. In this he also gives room temp pH numbers.

I came across this inconsistency when I started reading more technical brewing literature. The pH optima listed for the enzymes for the given optimal mash pH ranges just didn’t line up with what I heard from other brewers. It took me a while and doing my own pH vs. conversion experiments to get a clearer picture of this topic.

And to answer the question that is most interesting to brewers, I believe that the optimal mash pH range is 5.3-5.5 for light beers and 5.4-5.6 for darker beers when testing a room temperature sample of the mash. This pH range is a good compromise between optimal enzyme activity, good boil pH and good cast-out wort pH.