Yeast growth experiments – some early results

For a while now, actually ever since I got the microscope, I have been keeping track of yeast growth in starters, fast ferment tests and some beer fermentations. In some cases I was too lazy and did not record any data. But what I found is that the new growth per gram of extract (stuff dissolved in wort), measured in Billion per gram, was all over the place. Initially I thought I could come up with a simple formula to estimate cell growth based on wort volume and extract content. But that doesn’t seem to be the case.

So I started examining the issue in a more controlled environment. For my first set of experiments I prepared 6 l of ~10 Plato wort from old malt extract and some left over wort I had in the freezer. This was frozen in three 2 l soda bottles. I then grew some WY2042 from a slant to use in these experiments. WY2042, Danish Lager, works well since it doesn’t flocculate when its done fermenting. To conduct the experiment I would thaw one of the bottles with wort and keep it in the fridge. I then take ~230 ml of that wort innoculate it with yeast and place it on a stir plate covered with foil. The initial cell count was determined with a hemocytometer and the yeast was allowed to complete fermentation for 1 to two days. Then the final cell count is taken and the sample is allowed to settle in the fridge. For the next experiment some of the yeast sediment is kept in the flask and fresh wort is added. The amount of wort added is recorded as well as the initial cell count. Using this approach allows me to run a series of experiments with yeast of consistent freshness and only one stir plate. To eliminate age effects I went back and forth over the starting cell density range of 1 through 270 Million cells per ml. In the chart below you see Billion cells per liter, which is the same.

Here are the results:For reference I also added numbers I got from Jamil’s and the Wyeast pitching rate calculator.  The dashed lines show which experiment provided yeast for the next experiment.

There are notable differences at low and high starting cell densities.  In my experiments the specific growth I got at high starting cells counts (>150 B/l) was much less than the two pitching rate calculators predicted. The low growth makes sense since more sugar will be needed to feed the larger population during its lag phase. I think that this might be more pronounced with older yeast cultures where glycol reserved are lower (these yeast cultures sat only 1-2 days between propagation).

I also saw larger than expected growth at low starting densities.

Around initial densities of 100 B/l, the experimental results agree with the other two calculators which is good and means that there is some predictability.

You also see one data point for a 2nd series of the experiment. In that series I started a new culture from a slant and want to see if it behaves similarly.

The error bars get lager for higher starting densities since the error for counting the initial population plays a larger role when that population is large. E.g if the starting population is 1 Billion and has an error of 10% (+/- 0.1 Billion) and the final population is 100 Billion with a 1o% error (+/- 10 Billion) the error for the new growth of 99 Billion is ~ 10% or +/- 10 Billion. But if the starting population is 101 +/- 10 Billion and the final population is 200 +/- 20 Billion the difference is still 99 but with an error of +/- 22.

Stay tuned for more data as I have it ready for publishing.

Yeast un-flocculation for cell counting

One problem in cell counting is that the cell culture needs to be evenly suspended in its volume and any cell clumps need to be broken up. That is not an issue with poorly flocculating yeasts like German ale yeast. But heavy flocculators like English Ale yeast (WLP 002)  provide a challenge. I knew that any yeast can be un-flocculated in the presence of maltose since maltose inhibits flocculation. This makes sense since it it more advantageous for the yeast cells to float freely when food is available. However, adding fresh wort to a yeast slurry simply for counting its cells seems a bit wasteful.

So I asked White Labs about this and their response was to use sulfuric acid or EDTA (Ethylenediaminetetraacetic acid). A search on EDTA revealed that it is a chelating agent. This makes sense in the context of preventing yeast flocculation since it is able to chelate the calcium necessary for flocculation.  This gave me ideas for other chemicals that might work.

Tonight I spent some time in my lab/fermentation room to test a variety of chemicals for their ability to un-flocculate WLP002, the heaviest flocculator I have encountered so far. I had some WLP 002 sediment from the fast ferment test for a pale ale I brewed last weekend.

The experimentation set-up was simple. I added a little bit of WLP002 sediment, water and the de-flocculation agent I wanted to test to test tubes. Then I closed the test tubes and sloshed the contents around to see if the clumps are breaking up. When the sample was un-flocculated I inspected a sample under the microsope to check if there are truly no clumps of cells left. Here is what I found:

  • water: this was the control. While the yeast clump did break up it only broke up into small floccs of yeast. This was not good enough for counting.
  • fresh wort: it didn’t take long for the yeast clumps to break up into individual cells after brewing wort was added. This is the best option if the yeast sediment needs to be suspended anyway for pitching or as another stage of yeast propagation. This method does not kill the yeast and the viability can be assessed with methylene blue.
  • glucose: clumps broke up slowly. This method does not kill the yeast either, but it is not very practical since there are better options.
  • sulfuric acid: works very well. Clumps broke up very quickly and it doesn’t kill the yeast which allows for methylene blue staining. But sulfuric acid is a hazardous chemical and needs to be handled with care
  • PBW: Yes, Five Star’s Powdered Brewery Wash. I got the idea to use this since it also contains chelating agents. It works very well and the cells were quickly suspended as individual cells. It does not dissolve the yeast immediately but kills them. When stained with methylene blue a significant number of cells stained blue while the culture had a known viability of 95+%. PBW is much safer to handle than sulfuric acid and many brewers have it at hand.
  • GH test solution: since calcium chelation is the key for many of these agents and general hardness (GH) tests do just that I also gave this a try. It worked very well but is not practical due to its cost. The amount that can be found in a simple GH/KH test kit for $6 would only be enough to un-flocculate a few yeast sediment samples.
  • disodium EDTA: I haven’t tried this yet but plan to test it when I order from a place that sells it. I expect that it works and that it does not kill the yeast either.
  • Phosphoric acid: (mentioned by Northwestbeer in the comments for Yeast pitching by weight) Works very well, is generally available in a home brewer’s lab and does not kill the yeast. When I tried it I used about 2% phosporic acid (1 ml 10% phosphoric acid, 3 ml water and 1 ml yeast sample)

For now I’ll use fresh wort when I need to re-suspend the yeast in wort anyway and I’ll use PBW when I only need to count the cells in a given slurry of yeast without plans to use the yeast later.

Yeast pitching by weight

For a while now I have been tracking yeast propagation data in a big spread sheet. But not every yeast propagation gets logged in there since I don’t always bother about taking cell counts.

However, I do have a few data points that are of interest when it comes to pitching yeast by weight and calculating starter volumes. The latter I’ll save for another day.

The idea of pitching by weight relies on having reasonably accurate idea of the cell count per gram of yeast slurry. With this the cell count can be estimated from the yeast slurry’s weight. Weighing of propagated yeast is simple if you know the weight of the propagation vessel (for most brewers that will be an Erlenmeyer flask). It’s a good idea to mark the empty weight on the flask. You should also note the weight of the stir bar if you are using one. You should stir your starters.
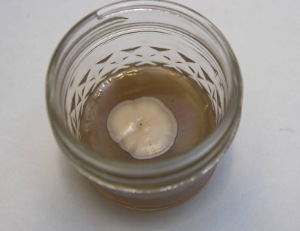
Simply decant the spent starter beer until left with yeast sediment and stir bar. This works best with strains that floculate well. Weissbier yeast, for example doesn’t settle into a dense sediment and you’ll loose some slurry during decanting or have to leave a fair amount of starter beer in the sediment.

Then weigh the flask, subtract flask and stir bar weight and you have the yeast sediment weight.

That also works for washed yeast. If you don’t wash yeast and want to use the yeast sediment from a primary, turn the carboy upside down and let the yeast drip into a sanitized cup or beaker.

But how much yeast is in that sediment?

Here is some data I have:

  • freshly propagated WLP 830 sediment contains about 4.5 Billion cells per gram. I have 4 data points ranging from 4.0 to 4.9 B/g. My starters have very little trub since I use leftover wort that has already been boiled for 60+ min
  • harvested WLP 830 contains about 2.5 Billion cells per gram. I don’t get much trub into the fermenter. Virtually no hot break and maybe 50% of the cold break.
  • I have only two data points for freshly propagated WLP 833. The average is 3.8 B/g. This can safely be rounded up to 4 B/g
  • WLP 001 and WY 1272, both American Ale type yeasts, showed about 2.5 B/g in freshly propagated yeast sediment. These yeasts flocculate well and the sediment was as dense as the sediment for WLP 830/833. The yeast cells might just be a bit bigger than lager yeasts. I haven’t compared them under the microscope.
  • The only top crop data I have is for WY1272 and that showed 2.7 B/g, which is close to the freshly propagated sediment. I would expect that washed yeast sediment has about the same density.

That’s all the reliable data I have. I have used English ale yeast (WLP 002), but that one flocculates so strongly that I was not able to count yeast cells.

The little data I have suggests that clean lager yeast sediment contains almost twice the number of yeast cells than comparable ale yeast sediment and that harvested sediment has about 60% the cell count of clean sediment.

Feel free to use these numbers as guidelines and keep in mind that being off from the actual yeast count by +/- 25% should not be a big deal. Most pitching rate experiments where brewers evaluated under and over pitching where done with 0.5x, 1x and 2x the recommended pitching rate or an even greater spread.

If you have sediment density data of your own, that you are willing to share, feel free to do so.

The effect of zinc on fermentation performance

This is the 2nd series of experiments regarding the effects of various additives and fermentation conditions on fermentation performance and beer quality. This time I wanted to take a closer look at the impact of various levels of zinc additions on fermentation performance.

Zinc is an important co-factor in many enzymes and thus a requirement for yeast growth. Most yeast strains require 0.1 – 0.2 mg/l of zinc. Zinc levels greater than 0.6 mg/l can inhibit yeast growth (Priest, Handbook of Brewing).

Zinc may be the only yeast nutrient that even barley malt is deficient of. As a result fermentation performance may benefit from the addition of zinc. This is why I conducted this experiment.

In the end I was not able to find any significant difference between the control fermentation and the 4 different levels of zinc additions with the exception of yeast growth. The most yeast growth was observed for the fermentation that added 0.2 mg/l zinc. This would agree with the literature which mentions possible yeast growth inhibition at total zinc levels above 0.6 mg/l.

The absence of other differences may be because the wort (98% Pilsner malt wort) contained sufficient zinc for the yeast that was used (WLP 830) or that the yeast was not able to utilize the zinc that was added (in this case the yeast growth differences would have to be attributed to a random error). The zinc came from simple 50 mg zinc tablets that are available as dietary supplements in a grocery store.

Details of the experiment

The wort that was used was left over from a Pilsner brewed with

  • 96% Best Pilsner Malt
  • 2% Weyermann Sauermalz
  • 1% Weyermann CaraMunich I
  • 1% Weyermann CaraPils

Mashed with a Hochkurz mash

  • 30 min at 65C
  • 45 min at 72 C
  • 15 min mash-out

moderately hopped with FWH Saaz and 60 min boil addition of hop extract

It was boiled and cooled before a stir plate and O2 were used to achieve a wort oxygen content of ~12 ppm. WLP 830 yeast was then added and allowed to un-flocculate completely before the pitching rate was determined with a hemocytometer. The pitching rate was about 9 Millon cells per ml.

About 413-125g of this pitched wort were poured into 5 500 ml Erlenmeyer flasks. In order to eliminate the effects of settling yeast during this process flasks were filled in random order and the cell density in the remaining wort was also determined. That cell density was around 10 M/ml. As a result there was no significant yeast settling that may have lead to different pitching rates.

Wort oxygenation while the oxygen content is monitored with a dissolved oxygen meter

To provide varying levels of zinc additions a 50 mg zinc tablet was dissolved in 185 ml water resulting in a 0.27 mg/ml solution. 0, 0.3, 1, 4 and 8 ml of this solution were added to the 5 different fermentation resulting in 0.0, 0.2, 0.7, 2.6 and 5.1 mg/l of zinc addition, respectively. To keep the addition of water the same DI water was added such that the water addition was 8 ml for each fermentation.

Zinc solution and Zinc tablets

The flasks were sealed with an airlock and their initial weight was determined before they were placed into a temperature controlled freezer chest. The initial ambient temperature was 7.5 C and was later raised to 11.8 C.

All five flasks in the freezer chest with the temperature probe in their middle

The flasks were weighed about twice per day for 15 days until the weight loss stabilized. At that point the extract content of the beer was determined with a precision 0.990 – 1.020 sg hydrometer before the beer was filled into a bottle along with 1.9 g of sugar and some of the yeast sediment.

The yeast sediment remaining in each flask after all beer was decanted was determined by weighing the flask and subtracting the empty weight of the flask.

About 1 oz of beer was left over which used to measure pH and these samples were also tasted.

These are the various metrics that were collected for all 5 fermentations:

test name A B C D E
zinc added 0.0 0.2 0.7 2.6 5.1 mg/l
stating extract 11.6 Plato
attenuation limit 78.4% ADF
yeast strain WLP830
yeast source Pils Fast Ferment Test sediment

yeast age 1 day
fermentation type still, airlock
starting O2 12.4 mg/l
pitching rate 9 M/ml
fill order 1 5 4 3 2
extract drop per day 1) 1.3 1.3 1.3 1.3 1.3 Plato
final extract 2.8 2.8 2.8 2.8 2.8 Plato
ADF 75.9% 75.9% 75.9% 75.9% 75.9%
attenuation delta 2.5% 2.5% 2.5% 2.5% 2.5%
yeast sediment weight 8.0 9.0 8.3 7.7 7.2 g
pH 4.50 4.55 4.55 4.55 4.53

1) refers to the extract loss per day during the most intense part of the fermentation and was determined from the slope in the fermentation profile

And the fermentation profile:

fermentation profile as percent weight loss over time

For some reason the “+8 mg/l Zn” fermentation showed a larger weight loss (measure of lost CO2) then the other fermentations, but that did not show up as higher attenuation or lower final extract. It is not known what could have caused this increased weight loss.

The fermentation metrics for all 4 beers are very much the same. The most yeast growth was achieved for the “+0.3 mg/l Zn” fermentation, while higher additions led to less yeast growth. This might be an result of total wort zinc levels in excess of 0.6 mg/l which is known to inhibit yeast growth. This yeast growth inhibition did not affect other fermentation parameters like extract drop per day during the most intense part of fermentation.

There were no taste differences that I detected between the beers. Tasting of samples was done after the measurements were taken and my taste perception could have been influenced by my expectation that there would be no difference.

It is possible that the zinc had no effect and that the yeast sediment weight differences are the result of a random error. On the left is a picture of the ingredients label. Zinc is present in these caplets as Zinc Gluconate which may not readily release Zn2+ into the wort. The use of zinc chloride would have been more reliable, but I didn’t have that at hand. Maybe for a later experiment I get ZnCl2.

Pitching Rate Experiment

I finally got around to conduct a new set of experiments. These experiments focus on fermentation. Rather than brewing full batches of beer and change parameters I’m using wort left over from full size batches to run a few small scale fermentation experiments.

The first set of experiments focused on pitching rate. Since pitching rate is a parameter that has been evaluated by many brewers I didn’t expect too many surprises. I was mostly interested in testing my approach, in particular using the weight change of the fermenting beer as an indicator of the progression of fermentation. This weight drop is the result of escaping CO2.

300 ml of 12 Plato beer contain about 36g of extract. With an apparent attenuation limit of 80% about 66% or 23.8g of this extract is fermentable. About 1/2 of its weight is converted to CO2 of which the majority escapes. This means during fermentation the beer looses about 11g or 4% of its weight. This weight loss can easily be followed using a scale with an accuracy of 0.1 g. The scale I use is a cheap kitchen type scale with a capacity of 2 kg and a precision of 0.1g. It has shown excellent repeatability of weight measurements.

Setup

For this experiment WLP 830 yeast sediment from a fast ferment test was added in different amounts to about 355g of 13.1 Plato Pilsner wort. The wort was aerated to about 7.2 ppm O2 before it was divided into the individual 500 ml flasks for the experiment. The yeast was brought into suspension and pitching rates were determined though cell counts.

The beer was not agitated during fermentation and the flasks were closed with an airlock. The mean ambient fermentation temperature was 18 C. Weight measurements were taken twice daily. After 7 1/2 days, once the weight stabilized and approached the expected weight loss, the extract was measured using a hydrometer and the beer was filled into individual 12 oz bottles. Sugar syrup and some yeast was added to carbonate the beers.

To asses the level of yeast growth that happened during fermentation all beer was decanted from the flask and the flask with sediment was weighed. The empty weight of all flasks used was known and hence the weight of sediment could be determined. To estimate cell count a sediment density of 4 Billion cells per gram was assumed. This is a number that I found true for yeast sediments from fast ferment tests or yeast propagation.

Results


The following chart shows the beer’s weight drop (in %) during fermentation for all 5 pitching rates:

The following table shows metrics that were measured

test name A B D C E
stating extract 13.1 Plato
attenuation limit 80.0%
yeast strain WLP830 from slant
yeast source Bo Pils FFT
yeast age 2 days
fermentation type still, airlock, in 500ml flask
fermentation temp 18 C
starting O2 7.2 mg/l
pitching rate 32 23 15 9 2 M/ml
extract drop per day 1) 3.5 3.7 3.7 3.0 2.8 Plato
final extract 2.7 2.7 2.7 2.8 2.9 Plato
attenuation delta 2)
0.6% 0.6% 0.6% 1.4% 2.1%
yeast growth 36.0 30.7 37.5 33.9 29.3 B
growth per extract 0.77 0.66 0.81 0.72 0.63 B/g

1) the extract drop per day was for the most active part of the fermentation

2) difference between limit of attenuation and actual attenuation

Discussion

The progression of the extract or weight drop during fermentation was as expected: The higher the pitching rate the faster the fermentation start and the greater the extract drop during the most active part of fermentation. This has been observed before and is related to the greater initial yeast population.

It is also well known that beers with lower pitching rates have a more difficult time or take longer to attenuate fully. This was observed as a higher final extract for the beers with the lowest pitching rates compared to the beers with higher initial pitching rates. The differences were not very dramatic, though.

The amount of yeast growth showed a correlation to pitching rate. Higher pitching rates lead to more yeast growth (the initial cell population was considered in this analysis) but the differences in yeast growth were not large. The highest pitching rate yielded about 25% more yeast growth. This might be due to the fact that yeast growth was limited by sterol reserves. A large initial population has more combined sterol reserves than a small initial population which means that it can sustain more cell divisions.

I have not yet tasted the finished beer and also plan to measure the pH of each of these beers at that point.

Yeast propagation experiment

I finally ran a brewing experiment again and am dusting off this blog to post the results.

The experiment was a repeat of a standard experiment that evaluates yeast growth in still, intermittently shaken and stirred starters. I like how easy it is to set up and plan to repeat it again.

Setup

919g of 12 Plato wort were aerated to 100% air saturation on a stir plate. Then 7.8 g WLP 830 yeast sediment from a primary fermentation was added and allowed to un-flocculate completely. The cell density was determined as 22.3 Million/ml with a hemacytometer. If you do the math you find that the slurry contained a total of about 20 Billion cells which means its density was 2.63 Billion/g. Previous slurry density assessments for slurries from yeast propagation ranged from 4-5 Billion/g for this yeast. I assume that trub played a big role in the reduced cell count in this slurry.

Once the yeast was evenly distributed in the wort, the wort was evenly divided into 3 500 ml Erlenmeyer flasks. The flasks were labeled with their empty weight and covered tightly with aluminum foil. I didn’t tighten the cover intentionally. I noticed that this happens when I grab the flasks at their neck to shake them. I made sure that all of them had tightened aluminum foil caps, even though only one would be shaken intermittently.

All starters were allowed to complete fermentation. One sat still, one was shaken intermittently (1-2 times in the morning and 3-5 times in the evening) the last one was placed on a stir plate and stirred continuously. A vortex formed on the stir plate, but was eventually covered with foam when CO2 started escaping. The ambient temperature was around 18 C.

Data:

Once fermentation was complete the yeast was allowed to settle into a dense cake until the beer on top cleared. The beer was poured off and the flask’s weight with yeast and stir bar (in one of the flasks) was determined. From that, the empty weight and the stir bar weight the yeast weight was determined:

starter type total extract in starter (g) final yeast weight (g) estimated sugar utilization (Billion cells per g)
still 36 10.8 1.4
intermittent shaking 37 10.2 1.3
stirred 37 13.1 1.7

I only recorded the yeast weight and did not count the yeast with the microscope. Simply, because I did not want to spend too much time on this. To estimate the number of cells grown I assumed that the sediment had a density of 4.7 Billion/g, an average of the numbers I had assessed in earlier experiments.

Discussion and Conclusion:

The wort volumes for the three starters were not exactly the same, hence the difference in the extract weight.

I was surprised to see that the sill and shaken starters showed no difference in the amount of yeast that was gown from the available extract. This is different from the data reported by others (e.g. the great Maltose Falcon article on yeast propagation: Yeast Propagation and Maintenance: Principles and Practices) where a shaken starter grew significantly more than a still starter and a stirred starter outperformed a shaken starter by about 4x. The caption to the chart mentions that the data point for the still starter was taken from a different experiment, though.

Data I recorded on past yeast propagation steps (usually stirred)  and fast ferment tests (usually shaken) show more difference in extract utilization for yeast growth, but there are also a number of other parameters that have been different for those experiments. Most notably the starting gravity and the initial cell density.

I’ll have to repeat this experiment in the future to see what covering loosely with aluminum foil does and what an airlock would do to the extract utilization that can be achieved. And maybe I also find the time to count the final number of cells.

WLP-002 English Ale Giant Yeast Colony

Ever wondered what would happen if you let a yeast culture
on agar grow? The result is called giant yeast colonies which in the past have
been used to distinguish yeast strain. Differences in metabolism, flocculation characteristics
and genetic stability lead to differences in the appearance of the giant
colonies.

So I wanted to give it a try myself. Brewing Techniques
featured an article on that topic which pointed out that the growth medium
needs to be much thicker than the thin agar medium that is commonly used for Petri
dishes. Not having deep mycological Petri dishes I used 4 oz canning jars. The
growth medium was regular strength brewing wort solidified with agar. The BT
article suggests using gelatin but that didn’t work for me, likely because I
forgot about the advice not to autoclave the gelatin.

The agar surface was inoculated with very small amount WLP
002 (English Ale) yeast and allowed to grow for a few weeks at about 15-20 C (60-68
F). The result is shown below.

Apparent are “growth rings” which are considered typical for
highly flocculent yeast. Another interesting feature is the wedge shaped change
in yeast appearance (green arrow). This is likely caused by a mutation that happened to a
cell at the tip of the wedge which caused it and the cells originating from it
to grow differently than the other cells in the colony.

While growing giant yeast cells has little application in practical
brewing it is one of those fun things that can be done with supplies that I have
in the brewery anyway and I also plan to gow and document the giant colonies of
other strains in my yeast collection.