Effects of mash parameters on fermentability and efficiency in single infusion mashing
A PDF version of this article can be found here: Effects_of_mash_parameters_on_attenuation_and_efficiency.pdf
It is commonly known that there are many factors that effect the fermentability (limit of attenuation) of brewing wort. The series of experiments conducted here are aimed at understanding not only the qualitative impact but also quantify the changes of fermentability depending on the parameters that were considered for evaluation.
In Understanding Attenuation it is mentioned that final attenuation of a beer mainly depends on 2 factors: limit of attenuation (i.e. attenuation potential) and the yeast's ability to come close to that limit of attenuation. The limit of attenuation is only effected by mashing and the Fast Ferment Test has been introduced to determine it. For simplicity sake, these experiments only focus on single infusion mashes and explore the effects of the following mash parameters:
- saccharification rest temperature: This is the first factor that comes to mind for all grain brewers. For a single step saccrification rest, the mash temperature has a great effect on the fermentability of the resulting wort. The lower the temperature (within a given range of course) the longer the beta-amylase will be able to work and produce maltose. See The Theory of Mashing.
- time: Along with temperature this is one of the more important parameters in mashing. It determines how much time the enzymes will have to work on the mash.
- mash pH: the beta and alpha amylase enzymes have different optimal pH ranges and therefore the mash pH can effect the activity balance between these enzymes. See The Theory of Mashing.
- grind: larger grits of endosperm make it harder for the mash water to fully hydrate them and make the starches accessible to the enzymes. As a result lots of starch is released later when the beta amylase activity has already diminished. The result of a coarser grind is a lower limit of attenuation. See The Theory of Mashing.
- water to grist ratio: the enzymatic activity of the amylases is effected by the thickness of the mash. Thinner mashes enhance the maltose production and therefore increase the fermentability. See The Theory of Mashing.
- grain bill composition (base malt): mashes with high diastatic power (Pilsner, Pale) will produce more fermentable worts since they contain a lager amount of beta-amylase which can produce more maltose compared to mashes with lower diastatic power (Munich or large amounts of unmalted grains) assuming the same saccrification rest temperature.
Materials and Methods
All experiments were conducted at a relatively small scale with minimal overhead. The strike water was heated in the micro wave. The time spent in the micro wave was noted for each experiment and provided a guidance for future experiments. After a number of experiments it was possible to come close to a desired mash temp by estimating the necessary heating time. The water was then added to a small steel thermos bottle where it was left for about 5 min to settle and if necessary adjustments were made by heating it some more or removing the top to let it cool quicker. A Styrofoam stopper was fitted for the bottle which also held an alcohol filled thermometer. The tip of the thermometer reached into the water/mash and it was possible to read its temperature without opening the bottle. The settled temperature was recorded and the milled grain was sirred into the water. 5 min into the mash the mash temperature was recorded. It was also recorded 30 min into the mash. Then the mash was stirred and its temperature recorded 5 min later. The last time the temperature was recorded was at the end of the mash.
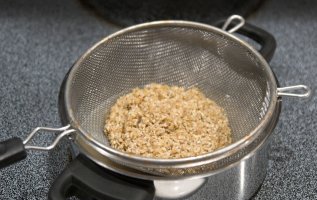
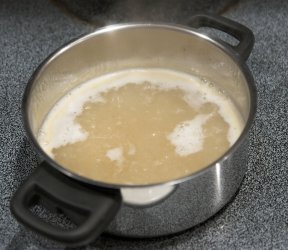
Once the 60 min mash was complete a sample of the wort was tested for starch conversion with iodine on chalk. This was not done for all mashes because sometime I simply forgot. The mash was then lautered through a stainer set over a pot. In all cases it took less than 2 min to bring the first runnings to a boil. In the meantime sparge water was heated in the microwave and the grain was well mixed with the water before it was lautered again through the strainer. This sparging technique resembled a batch sparge.
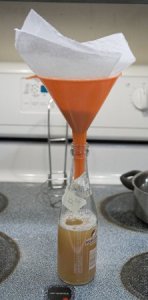
After the wort was boiled for 15 min it was strained though a paper towel set in a funnel. The funnel was placed into a clean 12 oz bottle. Initial experiments sanitized the bottles and the funnel in boiling water. But that became to cumbersome and due to the high pitching rate used the effect that infections could have on the attenuation measurement was deemed insignificant. As a result the bottles were only cleaned and somewhat sanitized in the dishwasher. The wort in the bottle was then topped of with reverse osmosis water when necessary to reach the same amount of final wort volume for all experiments. Initial experiments didn't care about the precise amount of wort in the bottle as long as there would be enough for 2 hydrometer readings, but later it was decided to keep the volume the same to get a measure of the efficiency along with the attenuation.
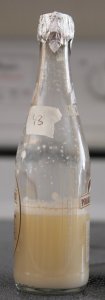
After capping the bottle with aluminum foil, the wort was left to cool at room temperature. Once cooled the original extract was measured with a hydometer (range 0 - 40 Plato) and then pitched with 1/2 teaspoon of Fleischman instant bread yeast and later experiments used Shaw's brand instant bread yeast. Dry bread yeast was chosen for its low cost and its consistency. In previous fast ferment tests, where it fermented along side other yeasts, it has been determined that it attenuates similar to other ale yeasts.
The samples were fermented at about 20 C (70 F) for 4-6 days. They were occasionally shaken to rouse the yeast. After the 4-6 days of fermentation the yeast started to settle and no visible signs of fermentation were left. The final extract (=final gravity) of the sample was measured with a more precise hydrometer (range 0.990 - 1.020). Both hydrometers were calibrated with various sugar solutions (20, 10, 5, 2.5 and 0 Plato) and the readings were also corrected for temperature.
Time experiments
For the time experiments, the following parameters were kept constant:
- grain type: Weyermann Pilsner Malt
- grain weight: 70g
- mill gap spacing: 0.55 mm
- reverse osmosis water and no pH adjustment of the mash. The resulting mash pH was measured as 5.4
- strike water volume: 240 ml
- mash starting temperature: 67 C and 72 C
- sparge water volume: 250 ml
- lauter efficiency was estimated to be about 90%
- boil time: 15 min
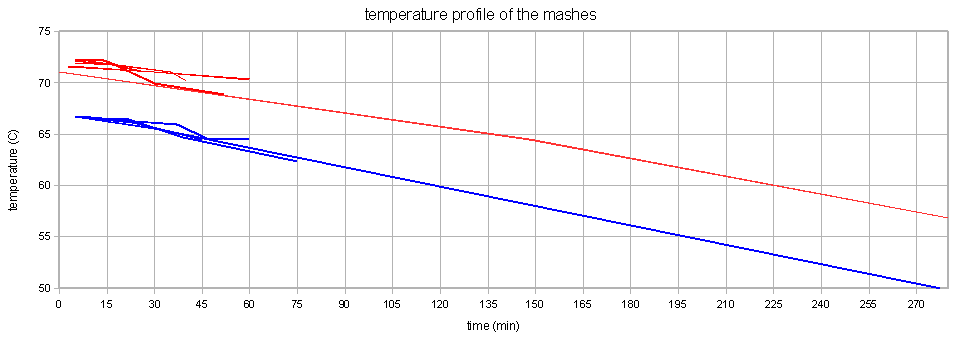
This series of experiments was actually done last, but it best illustrates how different temperatures effect mashing and as a result its data is presented first. To reduce the temperature drop during mashing, the thermos bottle was wrapped in sheets of foam generally used for packaging. But despite these efforts a temperature drop of ~ 3C/hr was still observed.
Temperature experiments
For the temperature experiments, the following parameters were kept constant:
- grain type: Weyermann Bohemian Pilsner Malt
- grain weight: 80g
- mill gap spacing: 0.55 mm
- reverse osmosis water and no pH adjustment of the mash. The resulting mash pH was measured as 5.4
- strike water volume: 240 ml
- mash time: 60 min
- sparge water volume: 250 ml
- lauter efficiency was estimated to be about 90%
- boil time: 15 min
pH experiments
For the pH series experiments, the following parameters were kept constant:
- grain type: Weyermann Bohemian Pilsner Malt
- grain weight: 70g
- mill gap spacing: 0.55 mm
- reverse osmosis water
- strike water volume: 240 ml
- starting mash temperature: 73 - 74.2 C
- mash time: 60 min
- sparge water volume: 250 ml
- lauter efficiency was estimated to be about 90%
- boil time: 15 min
- final wort volume: 15 min
The mash pH was ajusted with either white distilled vinegar (5% acetic acid) or baking soda (5% w/w NaHCO3 solution) which was added by volume with a small syringe.
The pH of the samples was measured at the end of the mash. Because the probe of the pH meter is getting old and its calibration function wasn't working anymore, the correction of the measured value was done externally by measuring the sample, a 4.01 reference buffer and a 7.01 reference buffer. The following equation was used to determine the actual pH of the sample:
corrected pH = 4 + 3 * ((sample pH - 4.01 buffer pH) / (7.01 buffer pH - 4.01 buffer pH))
In addition to that, the samples were also tested with EMD's colorpHast strips, which were read against the color scale in tungsten light. Reading them in fluorescent light actually changes their color. All samples were cooled to room temperature before measuring their pH. The pH meter that was used is a Milwaukee pH53.
Mill gap experiments
For the Mill gap experiments, the following parameters were kept constant:
- grain type: Weyermann Bohemian Pilsner Malt
- grain weight: 70g
- mash average temperature: 68 C
- reverse osmosis water and no pH adjustment of the mash. The resulting mash pH was measured as 5.4
- strike water volume: 240 ml
- mash time: 60 min
- sparge water volume: 250 ml
- lauter efficiency was estimated to be about 90%
- boil time: 15 min
The grain was milled with an adjustable 2 roller mill (Schmidling Maltmill). The gap of that mill was measured with a feeler gauge with an estimated precision of +/- 0.02 mm.
Mash thickness experiments
For the mash thickness experiments the following parameters were kept constant
- grain type: Weyermann Bohemian Pilsner Malt
- grain weight: 70g (for the 2.57l/kg and 5 l/kg series) and 120g (for the second 2.57 l/kg series)
- mill gap spacing: 0.55 mm
- reverse osmosis water and no pH adjustment of the mash. The resulting mash pH was measured as 5.4
- the total amount of water used was 5.6 l/kg for all experiments. (70g grist used a total of 390ml and 120g grist used 670ml water)
- lauter efficiency was estimated to be about 80%
- mash time: 60 min
- boil time: 15 min
The strike water was calculated to reach a mash thickness of 2.57 l/kg and 5 l/kg respectively. Because of the larger temperature drop that was encountered for the 2.57 l/kg mash with only 70g of malt, another series for that mash thickness was recorded with more malt and strike water to keep the actual mash volumes and temperature drops the same between the two series. After mashing additional water was added to adjust the total water use per grain to 5.6 l/kg. In order to keep the lauter efficiency the same for all these mashed this series of experiment was lautered using the no-sparge method in which all the malt and water were combined before the mash was strained though a strainer into the pot used for boiling.
Malt type experiments
For the malt type experiments the following parameters were kept constant
- grain weight: 70g
- mash average temperature: 70 C
- mill gap spacing: 0.55 mm
- reverse osmosis water with treatment as necessary to keep the pH values comparable
- strike water volume: 240 ml
- mash time: 60 min
- sparge water volume: 250 ml
- lauter efficiency was estimated to be about 90%
- boil time: 15 min
Since the color of the malt has an effect on the mash pH, one mash w/o adjusting the pH was done and based on the resulting mash pH the strike water was treated with vinegar or NaHCO3 solution such that the mash pH of the 2nd mash would be close to 5.3-5.5.
Calcium content experiments
For the Calcium content experiments the following parameters were kept constant
- grain weight: 70g
- grain type: Weyermann Pilsner
- mash average temperature: 69 C
- mill gap spacing: 0.55 mm
- strike water volume: 240 ml
- mash time: 60 min
- sparge water volume: 250 ml
- lauter efficiency was estimated to be about 90%
- boil time: 15 min
To create mash water with varying levels of calcium ions but constant residual aklaklinity (which would change the pH of the mash) 1.05g calcium chloride and 1.00g chalk were added to 2l distilled water. This resulted in a water with ~343 mg/l (ppm) Ca and a residual alkalinity of 0. To create a strike water with different Ca concentrations, the treated water was blended with distilled water at varying rated. But In order to keep the Ca concentration in the final wort the same, the sparge water was blended by using the reverse ratio. E.g. if an experiment used 20% 343 mg/l Ca water and 80% distilled water, the sparge water would consist of 80% 343 mg/l Ca water and 20% distilled water. Since the chalk does not readily dissolve in water, the treated water was shaken before use to resuspend the chalk.
Results and Discussion
Time
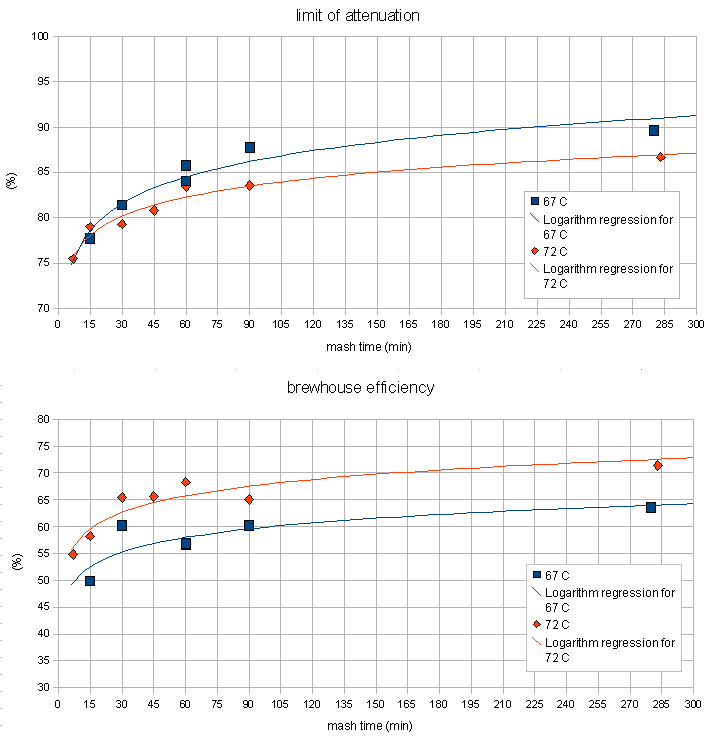
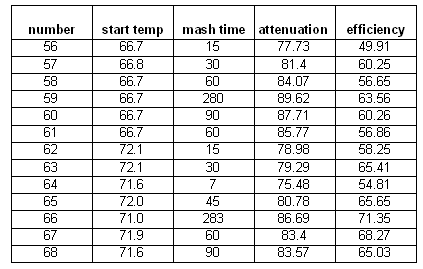
When the relationship between mash time, fermentability (limit of attenuation) and extract efficiency was examined, 2 trends were observed. The lower of the two mash temperatures (67C / 152F) resulted in a slower initial increase in extraction efficiency and fermentability compared to the higher mash temperature (72C / 162F). This is explained by a lower activity of both the alpha and the beta amylase enzymes at the lower temperature. And in the long run the mash with the lower mash temperature was able to create a more fermentable wort. This is a result of the greater stability of the beta amylase enzymes at the lower temperature. While they are initially not as active as in the higher temperature mash, they are active for a longer time and can therefore produce more maltose which increases the fermentability.
At temperatures at which the denaturation of the beta amylase dominates (70C/160F and above) the beta amylase becomes more of a "sprinter". It is able to create maltose at a higher rate due to the higher temperature which speeds up the reaction, but it denatures much quicker at the higher temperatures and as a result is not able to "cover as much ground" as it is able to at lower temperatures.
The higher temperature mash outperformed when it comes to extraction efficiency. This is a result of the stronger alpha amylase activity and possibly better gelatinization of the starches. Alpha amylase is the main enzyme for converting starch into water soluble glucose chains.
Unfortunately the temperature drop of the mash during the experiments was substantial ( ~3 C/hr, see Figure 8) which means that the beta amylase suffered less damage than it would have if the temperature for the 72 C mash would have remained at that temperature for a longer time. This can be seen in the continued increase of fermentability. While this could also be a result of alpha amylase activity it is assumed to be the result of lingering beta amylase activity. While alpha amylase is able to produce fermentable sugars as well it is not very effective at it. The effects of the increased denaturation of beta amylase can be seen in the steep rise of the fermentability that quickly falls behind the fermetability curve for the 67C mash temperature. This temperature dependent denaturation rate of the beta amylase is the main factor in the mash rest temperature dependence of the limit of attenuation.
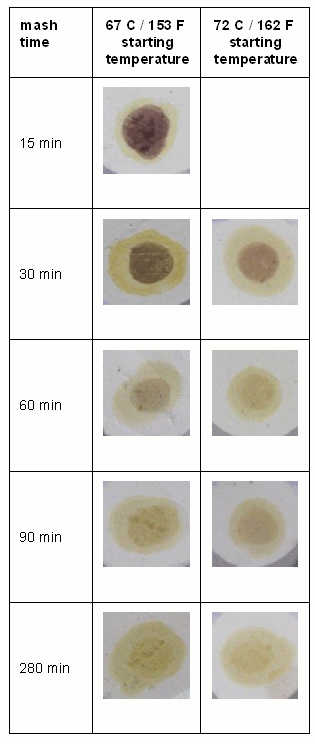
Another observation (Figure 7) that was made is that the hotter mash was able to reduce the iodine reaction (indication for free starch in the mash liquid) quicker than the mash at 67 C. This is another result of the increased alpha amylase activity in the mash done at 72 C.
Temperature
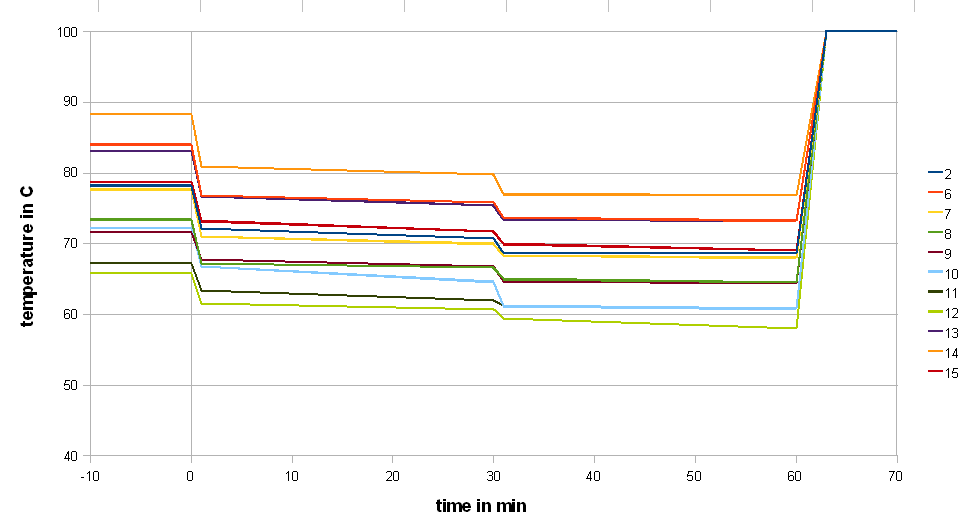
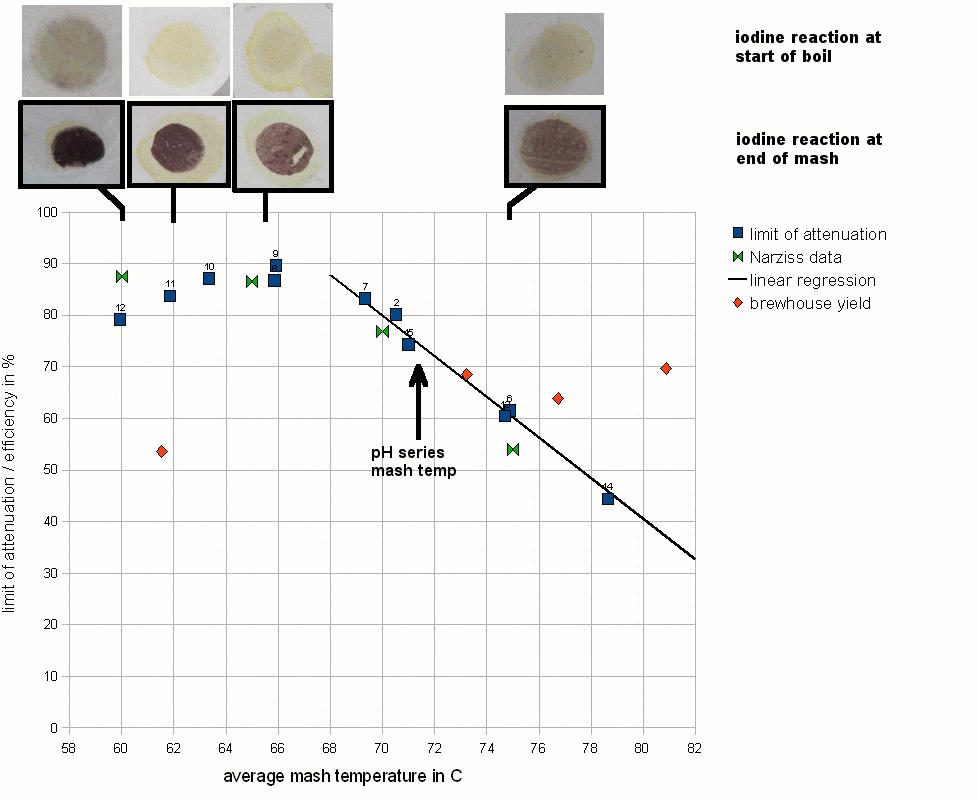
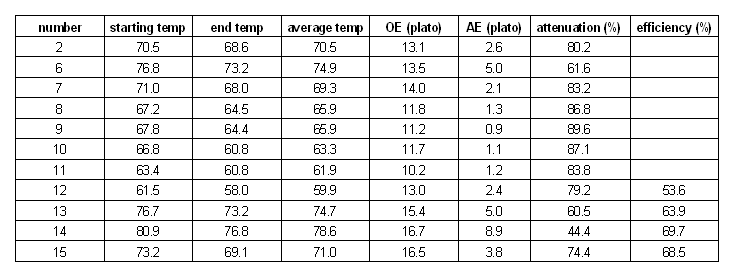
The next series of experiments discussed here evaluated the effect of the mash temperature on the attenuation. Unfortunately the small mashing vessel that was used (stainless steel thermos bottle) and the stirring at 30 min caused a significant mash temperature loss. Because of that the average mash temperature was used as the x-axis in Figures 10 and 11. The approximate mash profiles for all the sample mashes that were done are shown in Figure 9. Dough-in happened at time 0 and the mash was quickly lautered after 60 min. The average mash temperature drop was 4C (8F). The wort pH was measured at 5.5 (at room temperature)
Figure 10 shows the limit of attenuation numbers that were measured for the various mash experiments in this series. Two things were surprising. First, all data points track along a curve very nicely and there is not much difference between points at similar temperatures. This is an indication for the high repeatability and low statistical error of this experiment. Second, the curve matches the few data points that are listed in one of the literature references [Narziss 2005] fairly closely.
Another remarkable observation is the almost perfectly linear shape of the attenuation slope after its peak. The linear function that has been fitted to match the data points has a slope of ~ 4 %/C. This means that increasing the temperature by one degree Celsius (1.8 F) will lower the limit of attenuation by 4%. This was found to be true over a fairly wide temperature range (12 C / 24 F). However, the slope leading up to the peak of attenuation is not as steep. This is assumed to be a result of stronger beta amylase activity which causes the production of maltose as soon as starch gelatenizes and alpha amylase is breaking down the amylose and amylopectin molecules into shorter dextrines. Literature sources that show data for the fermentability of single infusion mashes at various rest temperatures don't show such a linear relationship past the peak of fermentability [Briggs, 2004]. It is assumed that the different shape of the temperature vs. attenuation curve shown in this experiment is effected by the relatively large temperature drop over the rest time.
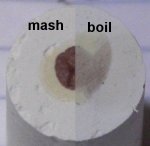
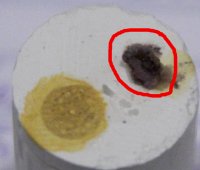
In addition to the attenuation, an iodine test on chalk was performed at the end of the mash and the beginning of the boil. The results can be seen at the top of Figure 10. Note the mahogany color, witch is an indication of existing dextrines. This was expected to be seen for samples with a low limit of attenuation, but even sample number 10, which achieved 87%, shows a significant mahogany iodine reaction. More iodine tests for samples past the attenuation peak need to be added to confirm a trend. Surprisingly little of the iodine reaction carried over into the boil even though care was taken to heat to wort quickly to minimize the time spend in a temperature range that favors the alpha amylase activity (68 - 78 C/ 155 - 172 F). Note that this quick heating is not realistic in brewing practice where even without performing a mash-out, the collected wort spends some time in this range while it is heated to boiling.
Later experiments (number 12 and up) were done in a way that allows for a comparison of the brewhouse yield by recording the post boil volume. Because the lauter efficiency can be assumed to be the same for all experiments (all mashes were lautered batch sparge style with 1 sparge), the differences in brewhouse yield (also known as brewhouse efficiency) must be largely due to changes in the conversion efficiency (a measure of how well the mash converted the starches available in the grist). From the few data points that exist so far it is evident that lower temperature mash rests lead to a lower mash efficiency. Which is expected since not as many starches have gelatinized yet and the alpha amylase which is the major enzyme responsible for liquefying starches is less active. Note that all experiments were done as 60 min mashes and that the lower efficiency at the lower mash temps can be accounted for by mashing for a longer time.
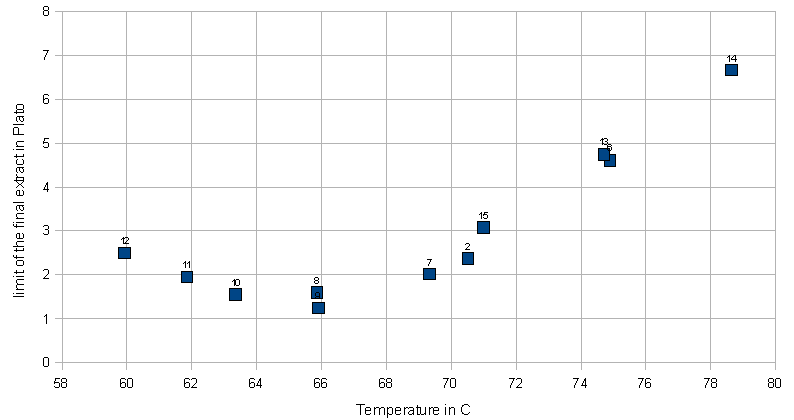
Figure 11 shows another twist on representing the attenuation data. For this chart, all the brewed worts were assumed to have an extract content of 12 Plato (equivalent to 1.048 SG). Instead of showing the limit of attenuation, the attenuation was used to calculate the lower limit of the final extract (=gravity) of the beer. This is the extract reading you would expect to get from a fast ferment test or a very well attenuating yeast which left the beer with very little or no fermentable extract.
pH
pH meter vs. colorpHast strips
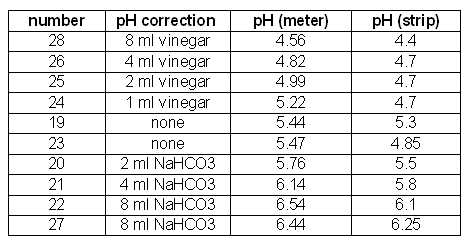
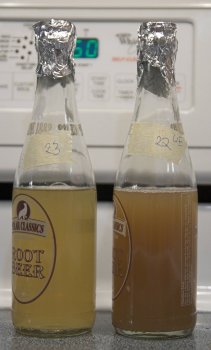
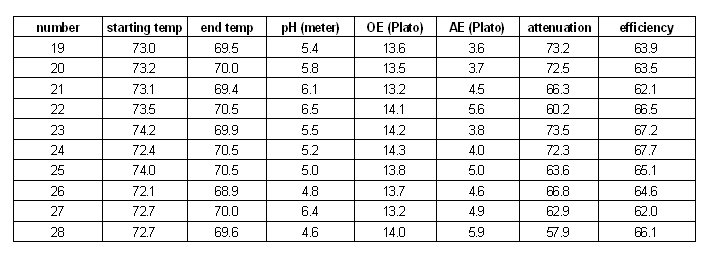
Table-1 lists the pH corrections that were done to the mashes and the pH that was measured with a pH meter and the pH determined with colorpHast strips. The first column lists the experiment number and the second column the amount of acid or baking soda solution that was added. It is interesting to see that the pH meter measurements for experiments 19 and 23, which both received no pH treatment, are fairly close while the strips must have been interpreted differently between the 2 experiments. Another remarkable observation are experiments 24, 25 and 26, which received different amounts of acid, caused different pH meter readings, but all read 4.7 on the color scale for the pH strips. This effect was also observed when I tested the pH meter against the strips a few months back. The results of that test are published here. The next section will show that 2 of these 3 samples (25 and 26) show very different limit of attenuation values which leads to the conclusion that there was indeed a pH difference between the two.
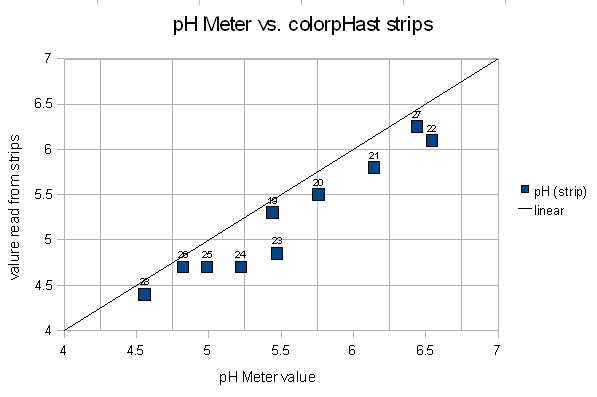
Figure 12 shows a plot of the colorpHast reading vs. the corrected pH meter value. The error was at most 0.5 (sample 24), which is significant enough to matter in brewing, but it happened at a pH level which is generally not achieved in mashing.
mash results
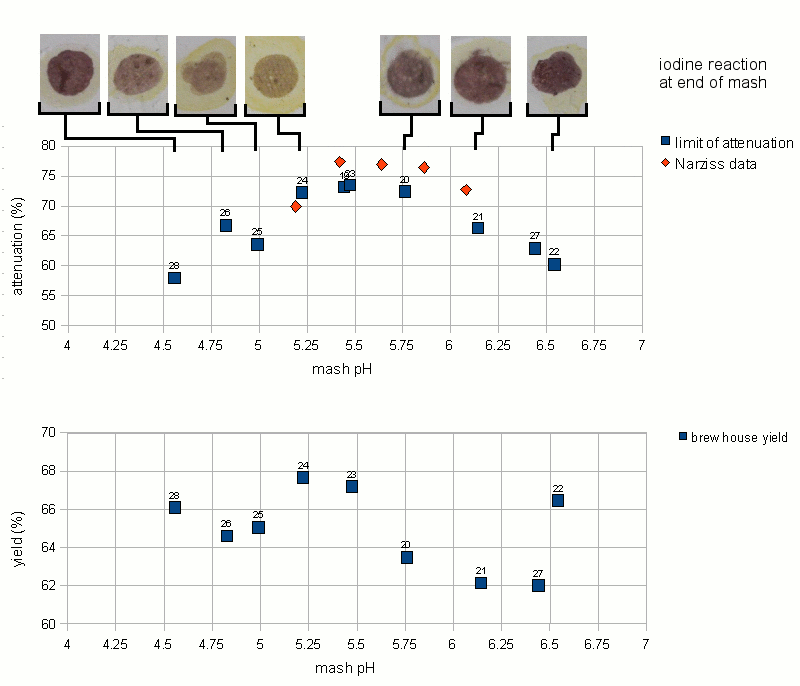
The mashing experiments for the pH series were performed with a single infusion mash that started at or around 73.5 C (164 F). This temperature is well on the slope that was determined earlier in the temperature series of experiments. The results of the pH experiments are shown in Figure 13.
The first observation was that the optimum for the limit of attenuation (fermentability) seems to be between pH 5.4 and 5.6. This matches the pH range that was given for the beta amylase enzyme in Narziss [Narziss 2005]. In addition to that the shape of the curve matches the attenuation data that Narziss lists for a few pH values. But he gave no information about the mash temp, mash thickness (though ~ 4 l/kg is likely) or other parameters that can effect the limit of attenuation. Because of that it can be assumed that all pH values given in that book were measured at room temp.
Outside of the 5.4 - 5.6 range the limit of attenuation declines. The slope of decline is steeper towards lower mash pH and a little less steep towards higher mash pH. This might be the result of a different decline of beta amylase activity. Number 26 is an outlier, but can be explained by being mashed at a lower than average mash temp. Though the termperature series showed an attenuation decline of 4% for every degree Celsius, it is unknown if this relationship also exists for low mash pH conditions.
The brewhouse yield (also known as brewhouse efficiency) also shows a dependency on the mash pH. This is not new as many home brewers report an increase in their brewhouse yield once they correct the mash pH to be in the optimal range for mashing. The optimum for the brewhouse yield seems to be near a pH of 5.2-5.3, which is a little lower than the optimum for the fermentability. This might be the result of of better alpha amylase activity in that range, although Narziss reports the alpha amylase pH optimum as being between 5.6 and 5.8 [Narziss 2005]. At the extreme end of the pH range that was tested are 2 outliers for brewhouse efficiency. Experiment 28 was done close to a pH of 4.5 and its brewhouse efficiency was greater than the efficiency for the experiment done at 4.8 pH. The same is true for experiment 22. But when that experiment was repeated as 27, the resulting brewhouse efficiency followed the established trend. It is assumed that the measurements were incorrect rather than being unexpected peaks of efficiency.
The iodine reaction at the end of the mash followed the trend that was already seen for the limit of attenuation and the brewhouse yield. The least reaction remained in the optimum mash range of 5.2 - 5.6 while at the extremes to either side native starch was still present in the mash liquid after a 60 min mash (purple color of the iodine test). Unfortunately no iodine test results are available for either of the two experiments that didn't receive any mash pH treatment. For experiment 28 (mash pH 4.55) the boiled wort was tested in addition to the mash and starch was still present. This shows that a pH well below 5.0 does not provide sufficient enzymatic activity to convert the mash. As a result of that the attenuation and brewhouse yield suffer and native starch will be present in the wort and subsequently in the beer.
Having a lower brewhouse yield and stronger iodine reaction also contradicts the pH and temperature ranges shown for the alpha amylase in John Palmer's How To Brew [Palmer 2006]. There it is shown that the alpha amylase is active well towards 4.5 pH and below.
Mill gap spacing
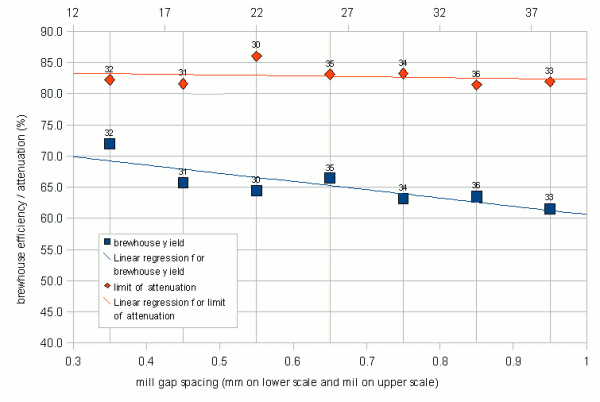
Figure 16 shows the results of the mill gap spacing series of experiments. The limit of attenuation shows little dependency on the tightness of the grind. This seems to indicate that either only little new starch is released from the coarser grind during mashing or that the beta amlylase shows activity throughout the duration of the mash. Given that the mash temperature was 68 C, similar to one of the temperatures in the mash time experiment it is assumed that the relatively small change of attenuation is a combination of both.
The brewhouse yield shows more dependency on the tightness of the crush. The tighter the crush, the higher the brewhouse yield. But the difference between a 0.35 mm (13 mil) crush and a 0.95 mm (37 mil) crush was only about 10%. Reports of significantly increased brewhouse efficiencies by home brewers after adjusting the mills to crush more tightly led me to expect a larger difference. But some of the default malt mill settings for home brewers and home brew stores are also greater than 0.9mm (37 mil) which was not taken into account when the decision was made to only evaluate mill gap spacings between 0.35 and 0.95 mm. The brewhouse yield dependence on the mill gap spacing can be explained by the larger amount of flour and smaller grits that are produced with a tight crush. These make it easier for the mash water to access the starches which is necessary for the enzymes to convert them into soluble carbohydrates (i.e. dextrines and sugars).
The literature reports that finer grists result in higher levels of fermentability. This behavior was not confirmed in this experiment but given the higher conversion efficiency that is achieved with the finer grists and the relatively unchanged fermentability it can be said that the finer grists produce more fermentable extract compared to coarser grists. If this was also the case for mashes that show less conversion efficiency sensitivity towards the mill gap spacing (e.g. if the close to 100% conversion efficiency is achieved with any mill gap spacing within a given range) such mashes would likely show a higher fermentability for finer grists.
For experiment 33 (0.95 mm mill gap) a piece of spent grain was taken from the spent grain, crushed on chalk and tested with iodine (Figure 17). The result was a deep black-purple reaction that is an indication of the presence of native starch. This shows where the lost efficiency is it is still present as native starch in the grain. But this was also the case for the spent grain from mash experiments with tighter mill settings. For some reason the mash experiments don't achieve the level of conversion efficiency which I commonly see in full size 60 min single infusion mashes. An indication of that is already present in the iodine tests which oftentimes showed a residual reaction after 60 min, something I don't see in full sized mashes either. One reason for that could be temperature loss and lower level of agitation (stirring) that happens for the experimental micro mashes.
Mash thickness
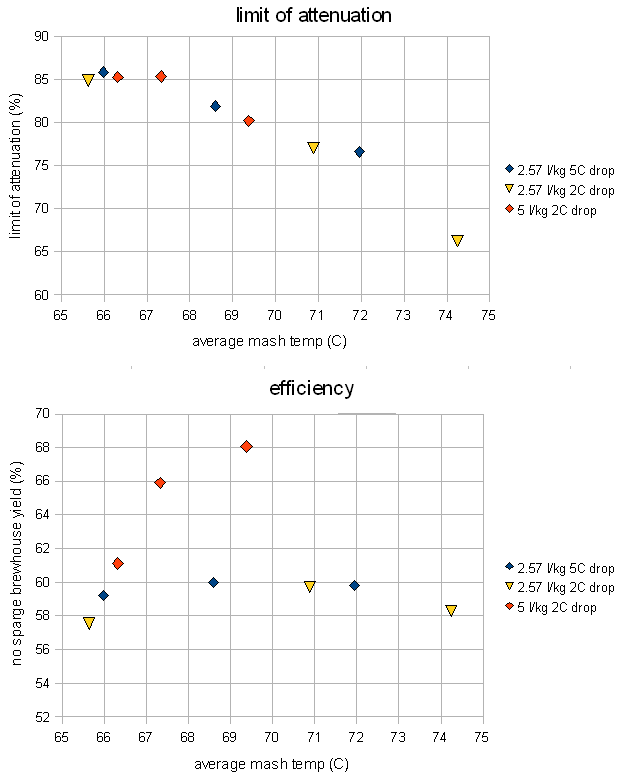
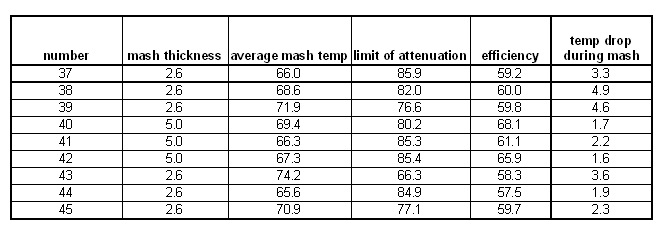
The results for mash thickness were somewhat surprising. Contrary to common believe no attenuation difference was seen between a thick mash (2.57 l/kg or 1.21 qt/lb) and a thin mash (5 l/kg or 2.37 qt/lb). Home brewing literature suggests that thin mashes lead to more fermentable worts, but technical brewing literature suggests that the mash concentration doesn't have much effect in well modified malts [Narziss, 2005]. Briggs cites data that doesn't show a change in fermentability when the mash thickness is changed [Briggs, 2004]. This was confirmed by these eperiments where all the data points were on the same curve that had already been established in the temperature experiment.
Note, that the experiments for the 2.57 l/kg mash were run twice because the initial experiment resulted in a small mash volume that lost 5 degree Celsius over the duration of the mash. To keep the temperature drop between the experiments the same the mash volume was increased and the result was a 2 degree Celsius temperature drop which matched the temperature drop for the 5 l/kg mash. But in the end that didn't make a difference.
A significant difference was however found in the efficiency. The brewhouse efficiency of the tick mashes remained almost constant between 58 and 60% over the temperature range of the experiments, but the brewhouse efficiency for the thinner mash showed a strong dependency on the temperature and was always better than the efficiency of the tick mash. That leads to the conclusion that thinner mashes perform better and allow for better extraction of the grain. Briggs also reports that thinner mashes can convert more starch but that most of the conversion potential is reached at a water to grist ratio of 2.5 l/kg [Briggs, 2004]
Malt type
Different malts, especially malts kilned at different temperatures provide different amounts of enzymes to the mash. This change in enzymatic strength leads to differences in the limit of attenuation and extraction efficiency.
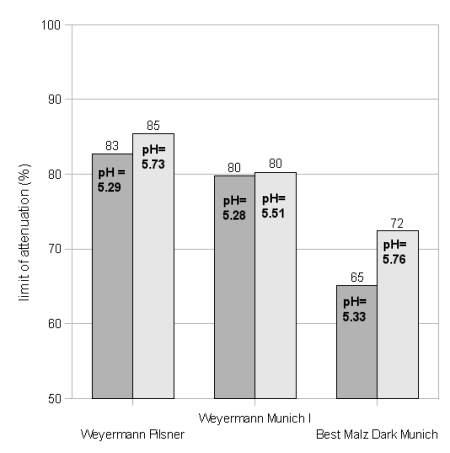
Figure 19 shows the attenuation results for 2 different pH values for each malt. There is not much difference between the light Munich (Weyermann Munich I) and the Pilsner malt. But the dark Munich malt shows a significant drop in the limit of attenuation when mashed at about the same rest temperature. This is a result of lower beta amylase activity due to the significantly reduced beta (and to some extend also alpha) amylase amount. Note that the Dark Munich experiment with the lowest attenuation was also mashed at a rest temperature that was about 2C higher than the average for the other malts at this pH. If we assume that there is a 4%/C drop of attenuation (as shown in Temperature) the limit of attenuation at a comparable mash rest should have been a little higher (about 63%).
Note that the limit of attenuation of a mix of these base malts would not be the weighted average of the individual malt's fermentabilities. This is because the pilsner malt has much more enzymatic strength than the dark Munich and will raise the fermentability by more than what its actual weight portion of the grist is.
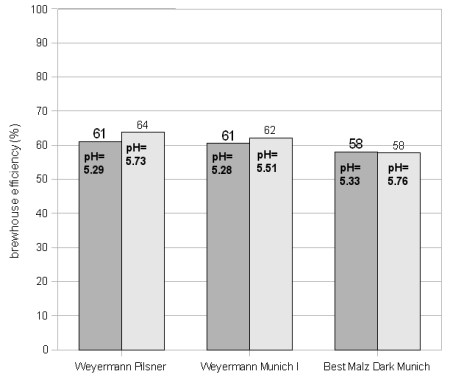
The brewhouse efficiency (Figure 20) was not as strongly effected even though the higher kilned malts showed a slightly lower brewhouse efficiency. This is somewhat surprising as recent full size (5 gal batch size) mashes with the Best Malz Dark Munich showed a much slower conversion than mashes that contain all or larger amounts of low kilned malts.
Calcium
As mentioned earlier, none of the mashes so far has been able to get to a conversion efficiency where 100% of the starch in the grist is converted to soluble extract (mainly dextrins and sugars). This rarely happens in the full size brewing batches (5 gal) even if they are single infusion mashes. One difference between the micro and the full size mashes is that water that is used. The micro mashes used reverse osmosis water with an approximate dissolved solid content of 30-50 mg/l (=ppm) while the full size mashed use reverse osmosis water and brewing salts. Based on this it was suspected that the mineral composition of the water has more impact than simply though the residual alkalinity and subsequently the mash pH.
One ion of particular interest is Calcium. Briggs notes that calcium stabilizes the alpha amylase [Briggs, 2004]. But since alpha amylase is still fairly stable at common saccharification rest temperatures (below 70C / 160F) the stabilizing effect of calcium shouldn't matter much.
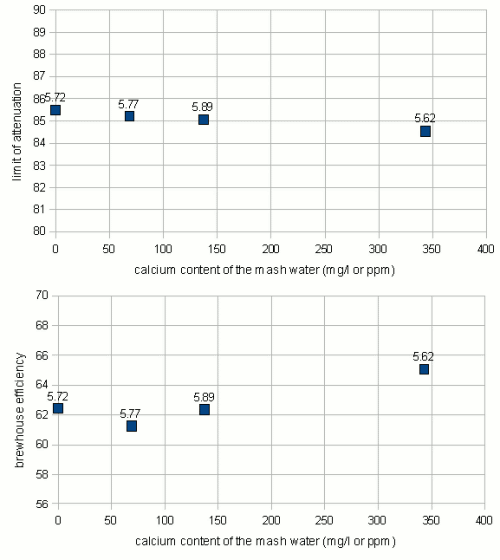
The experiments showed a slight downward trend for the fermentability if the amount of calcium in the mash is increased. But the difference between the highest and lowest attenuation is only about 1% which is well within the error range for these experiments. Based on that I would say that the calcium content of the mash has no impact on the fermentability.
A slightly stronger effect was seen for the efficiency. Here an almost 3% span was observed but since this is based on only a few samples that didn't match in their mash pH either the result may easily be called conclusive although the trend, the higher the calcium content the better the efficiency, matches the expectations.
Conclusion
Attenuation and efficiency of the mash are effected by many mash parameters. Some have more impact others have less. When using a single infusion mash, temperature and time are the best parameters that a brewer can work with to target a specific fermentability of the wort. The time should be long enough to allow for complete conversion of the mash or at least a wort that doesn't contain any starch (negative starch test). This might be achieved after 15-30 min, but a longer mash rest may be needed to achieve the desired fermentability. The mash pH should always be controlled and kept between 5.4 and 5.7 when measured at room temperature (5.05 - 5.35 when measured at mash temperature). This pH control can be done through the brew water design (residual alkalinity) and/or acid/salt addition to the mash.
Brewers that don't mill their own grain will not be able to effect the tightness of the crush and will have to accept lower conversion efficiencies or ensure that the mash has enough time and "strength" to achieve an acceptable conversion of the starches. If the mill gap spacing can be controlled the conversion efficiency can be improved through a tighter crush. But at some point the crush might be to tight for a resonable run-off speed.
The thickness of the mash doesn't seem to effect the fermentability of the wort that is produced but thinner mashes can significantly improve the conversion efficiency. As a result brewers who see low efficiency from their mashing may try to use a thinner mash (3-4 l/kg or 1.5 - 2 qt/lb) as they were shown to convert more starches.
When working with large amounts of highly kilned malts attenuation and efficiency problems can arise due to the lower diastatic power (enzymatic strength) of these malts. This can be counteracted by lower mash temperature and longer mashes or the addition of a diastatic stronger malt to the grist (e.g. 10-20% of Pale/Pilsner malt)
While the water composition may also have an impact on attenuation and efficiency besides the change in mash pH through the residual alkalinity, its impact is considered small and secondary.
Appendix
Tables
Time series
Temperature series
pH series
mill gap series
mash thickness series
malt type series
Calcium series
Sources
- [Narziss, 2005] Prof. Dr. agr. Ludwig Narziss, Prof. Dr.-Ing. habil. Werner Back, Technische Universitaet Muenchen (Fakultaet fuer Brauwesen, Weihenstephan), Abriss der Bierbrauerei. WILEY-VCH Verlags GmbH Weinheim Germany, 2005
- [Palmer, 2006] John J. Palmer, How to Brew, Brewers Publications, Boulder CO, 2006
- [Briggs, 2004] Dennis E. Briggs, Chris A. Boulton, Peter A. Brookes, Roger Stevens, Brewing Science and Practice, Published by Woodhead Publishing, 2004

