Difference between revisions of "Lactate Taste Threshold experiment"
| (2 intermediate revisions by the same user not shown) | |||
| Line 6: | Line 6: | ||
The question many brewers are struggling with is: How much lactic acid is needed to make a negative impact on the flavor of the beer while the mash pH is still in the desired range ? | The question many brewers are struggling with is: How much lactic acid is needed to make a negative impact on the flavor of the beer while the mash pH is still in the desired range ? | ||
| − | The literature provides little information on this topic. Brewing: Science and Practice lists a lactic acid taste threshold of 400 mg/l<ref>Dennis E. Briggs, Chris A. Boulton, Peter A. Brookes, Roger Stevens, ''Brewing Science and Practice'', Published by Woodhead Publishing, 2004</ref>. No detail is given if during these experiments the lactic acid was neutralized. This aspect is important since the sour taste of lactic acid comes from its ability to lower pH. When neutralized to the pH of the sample in which it is tasted lactic acid is more difficult to detect. | + | The literature provides little information on this topic. "Brewing: Science and Practice" lists a lactic acid taste threshold of 400 mg/l<ref name="Briggs">Dennis E. Briggs, Chris A. Boulton, Peter A. Brookes, Roger Stevens, ''Brewing Science and Practice'', Published by Woodhead Publishing, 2004</ref>. No detail is given about the experiments. It's unknown if during these experiments the lactic acid was neutralized. This aspect is important since the sour taste of lactic acid comes from its ability to lower pH. When neutralized to the pH of the sample in which it is tasted lactic acid is more difficult to detect. |
| + | Narziss and Back mention acidulated malt additions at levels as high as 8% to neutralize water alkalinity and lower the mash pH to a desirable level of 5.5 - 5.6<ref name="Narziss_Back">Ludwig Narziss, Werner Back, Die Bierbrauerei Band 2: Technologie der Würzebereitung, Wiley-VCH, 2009</ref>. For a 12 Plato beer brewed with 95% efficiency into kettle this adds 380 mg/l lactate to the beer. | ||
| + | A common upper bound of acid malt use given by home brewers is 4-5%. | ||
| − | + | To answer the question of taste threshold of lactate in water and beer I conducted a taste experiment with 8 members of my home brew club [http://www.bfd.org Brew Free or Die] as panelists. Each panelists received 4 sets of 6 different samples and was asked to sort them into one group in which the off flavor is not detectable and sort the rest by the intensity of that flavor. The panelists were not told what the off flavor is but knew which sample was the control. | |
| − | + | ||
| − | + | ||
| − | To answer | + | |
= Materials and Methods= | = Materials and Methods= | ||
| − | The four sets of samples were water, Bud Light, Budweiser | + | The four sets of samples were water, Bud Light, Budweiser and Sierra Nevada Torpedo Ale. I added increasing amounts of calcium lactate to these beers and water. It was important for this experiment that the addition of lactate did not change the pH of the sample which is why I prepared a 23 g/l lactic acid solution by adding 8.25 ml 88% lactic acid to 375 ml reverse osmosis water. A sample of that solution was taken and dry slaked lime (Ca(OH)<sub>2</sub>) was added until it reached the pH of the repective water or beer sample. If the pH was too high a bit more lactic acid solution was added to bring it down again. By doing so the lactate/lactic acid concentration did not change. |
| − | The resulting solution was then added to the samples. For the beers a mix of water and Ca-lactate solution was added to keep the total | + | The resulting solution was then added to the samples. For the beers a mix of water and Ca-lactate solution was added to keep the total addition of water the same. |
Water | Water | ||
| Line 44: | Line 43: | ||
{| class="wikitable" | {| class="wikitable" | ||
|- | |- | ||
| − | ! sample ID !! volume (ml) !! water added (ml) !! Ca-lactate added (ml) !! resulting lactate | + | ! sample ID !! volume (ml) !! water added (ml) !! Ca-lactate added (ml) !! resulting lactate concentration (mg/l) !! equivalent amount of acidulated malt for 12 Plato beer* |
|- | |- | ||
| 0 || 350 || 18.7 || 0 || 0 || 0% | | 0 || 350 || 18.7 || 0 || 0 || 0% | ||
| Line 59: | Line 58: | ||
|} | |} | ||
| − | <nowiki>*</nowiki> | + | <nowiki>*</nowiki> the equivalent amount of acidulated malt assumes an efficiency into the kettle of 85% and a lactic acid content of 3% (w/w) for the acidulated malt. |
| − | Samples were | + | Samples were assigned random letters with the exception of 0, which always received letter A. Each panelist received a score sheet on which he/she would note which samples taste like A and the intensity ranking of the off-flavor in the other samples. |
Samples were presented in this order: water, Bud Light, Budweiser, Sierra Nevada Torpedo Ale. | Samples were presented in this order: water, Bud Light, Budweiser, Sierra Nevada Torpedo Ale. | ||
| Line 69: | Line 68: | ||
= Results and Discussion = | = Results and Discussion = | ||
| − | One theme apparent during tasting was how much difficulty panelists had in consistently identifying the samples with the most | + | One theme apparent during tasting was how much difficulty panelists had in consistently identifying the samples with the most added lactate. This provided a challenge in deriving trends from the taste results. |
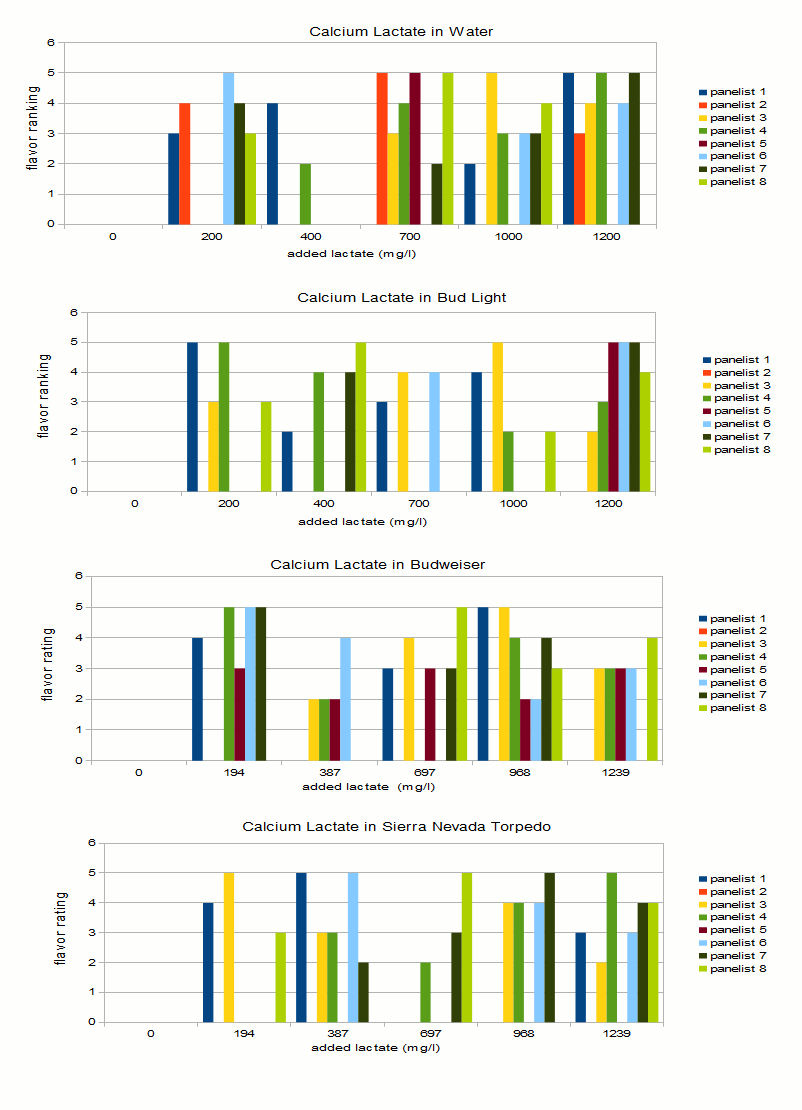
| − | Figure 1 shows the tasting results for the 4 sets | + | Figure 1 shows the tasting results for the 4 sets. An intensity of 0 was assigned to all samples that a given panelist indicated as tasting like the control. The sample with the most intense flavor was assigned a 5, the second most intense a 4 and so forth. The problem with this approach is that many panelists did not identify the sample with the most lactate as the one with the most intense off flavor. Panelist 6, for example noted that the water with 200 ppm lactate tasted most intense. |
| + | |||
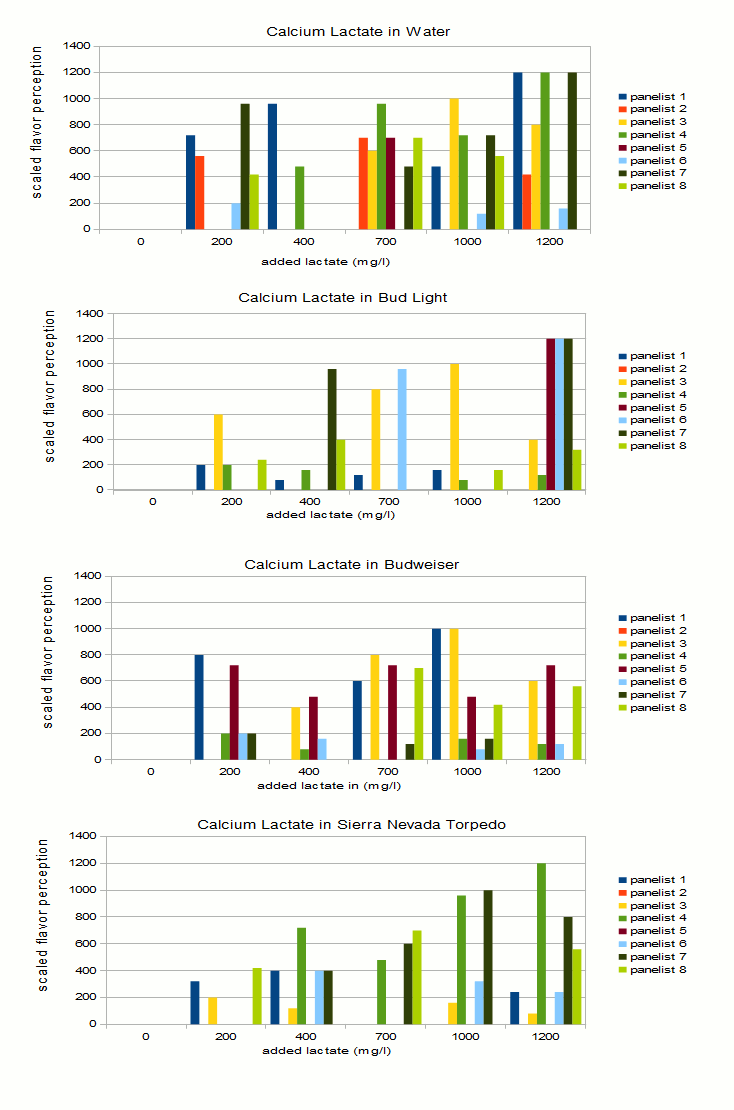
| + | To account for this I took the lactate level of the sample that was noted as having the most intense "off-flavor" and used it as the level for the most intense tasting sample indicated by that taster. The intensities of the other samples were then scaled based on that. That resulted in the charts in Figure 2. | ||
[[File:LactateTaste_charts_1.gif|frame|center|Figure 1 - The off-flavor rating given to the different samples by the 8 panelists. Samples reported as tasting like the control are shown as 0 while the sample with the most noticeable off-flavor is shown as 5. See text for further detail]] | [[File:LactateTaste_charts_1.gif|frame|center|Figure 1 - The off-flavor rating given to the different samples by the 8 panelists. Samples reported as tasting like the control are shown as 0 while the sample with the most noticeable off-flavor is shown as 5. See text for further detail]] | ||
| − | [[File:LactateTaste_charts_2.gif|frame|center|Figure 2]] | + | [[File:LactateTaste_charts_2.gif|frame|center|Figure 2 - scaled flavor intensity was determined by using the lactate level of the sample that a given panelist reported as tasting the most intense as the upper limit for that panelist.]] |
| − | Just by looking at the density and height of bars, lactate is more easily detected in water. This does not come as a surprise.Some identified it down to a level of 200 mg/l, while some where not able to detect it until it reached levels of 700 mg/l. | + | Just by looking at the density and height of bars, lactate is more easily detected in water. This does not come as a surprise. Some identified it down to a level of 200 mg/l, while some where not able to detect it until it reached levels of 700 mg/l. |
| − | Panelists had more difficulty | + | Panelists had more difficulty identifying the flavor in the 3 beers that were presented. To my surprise Bud Light did the best job of hiding this flavor. This may have been the result of panelists being unfamiliar with the taste of this beer, something that should also be true for Budweiser, or that it was the first flight of beer they were presented with. |
| − | Another explanation is that | + | Another explanation is that panelists had general difficulties identifying the flavors in the beers even when the highest amount added was 1200 mg/l. This becomes evident by the rather even spread of high ratings (5) over the 200-1200 mg/l range in Figure 1. In water those higher bars are more clustered toward the higher lactate range. |
Based on this and having tasted lactate in Budweiser myself, I'm willing to conclude that it is fairly difficult to detect added lactate at a level of 400 or below. | Based on this and having tasted lactate in Budweiser myself, I'm willing to conclude that it is fairly difficult to detect added lactate at a level of 400 or below. | ||
| − | This experiment was not able to show that the intensity of the beer flavor changes the perception threshold for additional lactate, although it showed that it is more | + | This experiment was not able to show that the intensity of the beer flavor changes the perception threshold for additional lactate, although it showed that it is more easily detectable in water than in beer. It seems logical that more intensive beer flavors would be able to mask higher levels of lactate, however, more experimentation is needed for this, in particular the maximum lactate level should be raised to allow it to stand out more prominently as many panelists misidentified the sample with the most lactate added. |
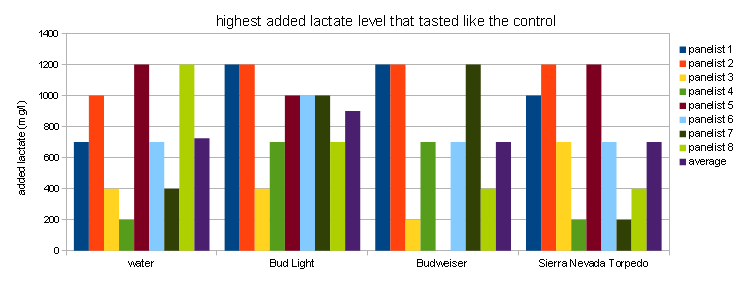
| − | Figure | + | Figure 3 is yet another way to look at the results. For each series and panelist it shows the highest level of lactate that was marked as tasting like the control. The correlations is not very strong but it shows that lactate was more easily detected in water. The high bars for Bud Light show that panelists had trouble detecting lactate in that beer. While generally low bars for Budweiser and Sierra Nevada Torpedo suggest that it was easier to detect in these beers. However, this is likely a random error since the low correlation between actual lactate levels and flavor rating suggests that most panelists ended up guessing or mistook other beer flavors for the off flavor. Palate fatigue is also an issue in this experiment due to the fairly large number of samples that were tasted. |
[[File:LactateTaste_charts_3.gif|frame|center|Figure 3 - The highest level of added lactate that was a given panelists reported as tasting like the control. The higher the bars the more difficult it was to detect the lactate]] | [[File:LactateTaste_charts_3.gif|frame|center|Figure 3 - The highest level of added lactate that was a given panelists reported as tasting like the control. The higher the bars the more difficult it was to detect the lactate]] | ||
| Line 93: | Line 94: | ||
= Conclusion = | = Conclusion = | ||
| − | It was surprisingly difficult for panelists to pick out beers that had lactate added even at levels that correspond to an acidulated malt use of 13% and higher. Note that the acidity of the lactic acid was neutralized with slaked lime. A | + | It was surprisingly difficult for panelists to pick out beers that had lactate added even at levels that correspond to an equivalent acidulated malt use of 13% and higher. Note that the acidity of the lactic acid was neutralized with slaked lime. A general recommendation for home brewers is to keep the use of acidulated malt below 5%, which corresponds to a level of 264 mg/l added lactate in a 12 Plato beer with 85% efficiency into kettle. Many of the panelists were not able to pick up the added lactate at a level of about 400 mg/l which corresponds to about 7.5% acidulated malt. Based on that we can safely say that even 8% acidulated malt won't ruin a beer if that amount is needed to counteract water alkalinity. |
= References = | = References = | ||
| − | |||
<references/> | <references/> | ||
|} | |} | ||
Latest revision as of 04:03, 11 March 2013
|
Lactic acid is a very popular acid for brewing water treatment and mash pH correction. Home brewers are using it in the form of acidulated malt or 88% concentrated lactic acid. A common concern with lactic acid is its impact on the final beer flavor when rather large amounts are used. Lactic acid is associated with sour beers and that flavor may not be welcome in a Pilsner style beer, for example. The question many brewers are struggling with is: How much lactic acid is needed to make a negative impact on the flavor of the beer while the mash pH is still in the desired range ? The literature provides little information on this topic. "Brewing: Science and Practice" lists a lactic acid taste threshold of 400 mg/l[1]. No detail is given about the experiments. It's unknown if during these experiments the lactic acid was neutralized. This aspect is important since the sour taste of lactic acid comes from its ability to lower pH. When neutralized to the pH of the sample in which it is tasted lactic acid is more difficult to detect. Narziss and Back mention acidulated malt additions at levels as high as 8% to neutralize water alkalinity and lower the mash pH to a desirable level of 5.5 - 5.6[2]. For a 12 Plato beer brewed with 95% efficiency into kettle this adds 380 mg/l lactate to the beer. A common upper bound of acid malt use given by home brewers is 4-5%. To answer the question of taste threshold of lactate in water and beer I conducted a taste experiment with 8 members of my home brew club Brew Free or Die as panelists. Each panelists received 4 sets of 6 different samples and was asked to sort them into one group in which the off flavor is not detectable and sort the rest by the intensity of that flavor. The panelists were not told what the off flavor is but knew which sample was the control. Materials and MethodsThe four sets of samples were water, Bud Light, Budweiser and Sierra Nevada Torpedo Ale. I added increasing amounts of calcium lactate to these beers and water. It was important for this experiment that the addition of lactate did not change the pH of the sample which is why I prepared a 23 g/l lactic acid solution by adding 8.25 ml 88% lactic acid to 375 ml reverse osmosis water. A sample of that solution was taken and dry slaked lime (Ca(OH)2) was added until it reached the pH of the repective water or beer sample. If the pH was too high a bit more lactic acid solution was added to bring it down again. By doing so the lactate/lactic acid concentration did not change. The resulting solution was then added to the samples. For the beers a mix of water and Ca-lactate solution was added to keep the total addition of water the same. Water
Bud Light, Budweiser and Sierra Nevada Torpedo
* the equivalent amount of acidulated malt assumes an efficiency into the kettle of 85% and a lactic acid content of 3% (w/w) for the acidulated malt. Samples were assigned random letters with the exception of 0, which always received letter A. Each panelist received a score sheet on which he/she would note which samples taste like A and the intensity ranking of the off-flavor in the other samples. Samples were presented in this order: water, Bud Light, Budweiser, Sierra Nevada Torpedo Ale. Some of the panelists were BJCP certified judges. Results and DiscussionOne theme apparent during tasting was how much difficulty panelists had in consistently identifying the samples with the most added lactate. This provided a challenge in deriving trends from the taste results. Figure 1 shows the tasting results for the 4 sets. An intensity of 0 was assigned to all samples that a given panelist indicated as tasting like the control. The sample with the most intense flavor was assigned a 5, the second most intense a 4 and so forth. The problem with this approach is that many panelists did not identify the sample with the most lactate as the one with the most intense off flavor. Panelist 6, for example noted that the water with 200 ppm lactate tasted most intense. To account for this I took the lactate level of the sample that was noted as having the most intense "off-flavor" and used it as the level for the most intense tasting sample indicated by that taster. The intensities of the other samples were then scaled based on that. That resulted in the charts in Figure 2. Just by looking at the density and height of bars, lactate is more easily detected in water. This does not come as a surprise. Some identified it down to a level of 200 mg/l, while some where not able to detect it until it reached levels of 700 mg/l. Panelists had more difficulty identifying the flavor in the 3 beers that were presented. To my surprise Bud Light did the best job of hiding this flavor. This may have been the result of panelists being unfamiliar with the taste of this beer, something that should also be true for Budweiser, or that it was the first flight of beer they were presented with. Another explanation is that panelists had general difficulties identifying the flavors in the beers even when the highest amount added was 1200 mg/l. This becomes evident by the rather even spread of high ratings (5) over the 200-1200 mg/l range in Figure 1. In water those higher bars are more clustered toward the higher lactate range. Based on this and having tasted lactate in Budweiser myself, I'm willing to conclude that it is fairly difficult to detect added lactate at a level of 400 or below. This experiment was not able to show that the intensity of the beer flavor changes the perception threshold for additional lactate, although it showed that it is more easily detectable in water than in beer. It seems logical that more intensive beer flavors would be able to mask higher levels of lactate, however, more experimentation is needed for this, in particular the maximum lactate level should be raised to allow it to stand out more prominently as many panelists misidentified the sample with the most lactate added. Figure 3 is yet another way to look at the results. For each series and panelist it shows the highest level of lactate that was marked as tasting like the control. The correlations is not very strong but it shows that lactate was more easily detected in water. The high bars for Bud Light show that panelists had trouble detecting lactate in that beer. While generally low bars for Budweiser and Sierra Nevada Torpedo suggest that it was easier to detect in these beers. However, this is likely a random error since the low correlation between actual lactate levels and flavor rating suggests that most panelists ended up guessing or mistook other beer flavors for the off flavor. Palate fatigue is also an issue in this experiment due to the fairly large number of samples that were tasted. ConclusionIt was surprisingly difficult for panelists to pick out beers that had lactate added even at levels that correspond to an equivalent acidulated malt use of 13% and higher. Note that the acidity of the lactic acid was neutralized with slaked lime. A general recommendation for home brewers is to keep the use of acidulated malt below 5%, which corresponds to a level of 264 mg/l added lactate in a 12 Plato beer with 85% efficiency into kettle. Many of the panelists were not able to pick up the added lactate at a level of about 400 mg/l which corresponds to about 7.5% acidulated malt. Based on that we can safely say that even 8% acidulated malt won't ruin a beer if that amount is needed to counteract water alkalinity. References |


