A simple Model for pH Buffers
|
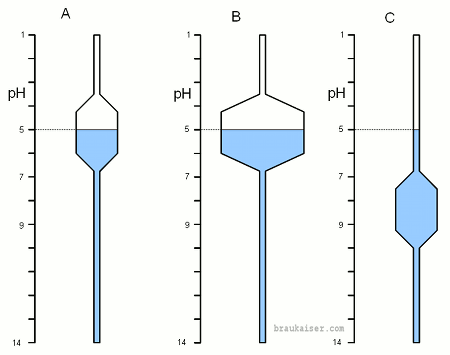
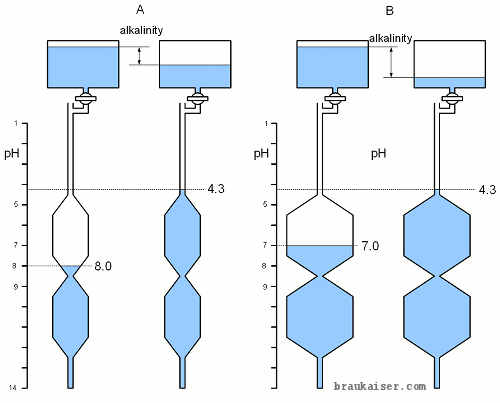
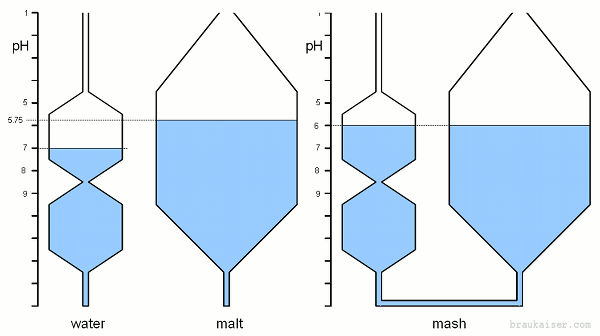
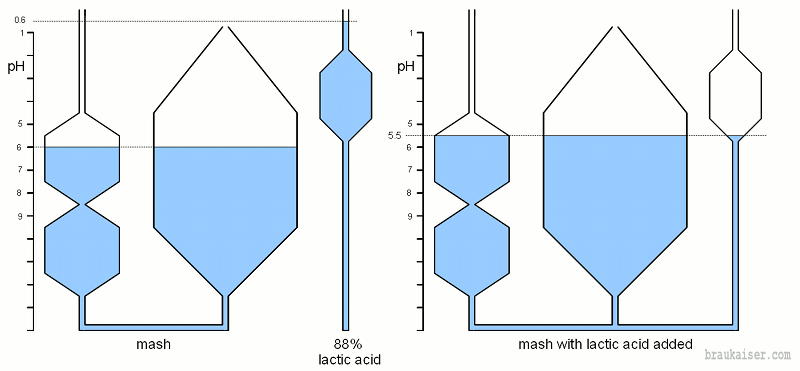
The understanding of pH buffers is critical for making sense of pH changes in mash, wort and beer. To most brewers the fundamentals that are associated with pH are not as intuitive as they are for example for temperature. Temperature is something we can feel and we have learned over time, through experience, how it is affected and how changes can be predicted and controlled. This is not the case with pH, which we can neither feel nor see and for which we have developed little intuition. This article tries to illustrate the concept of pH buffers and how they interact with acids and bases with the use of a simple model. Contents[hide]pH and buffersThe chemical fundamentals of pH were discussed in An Overview of pH. There we saw that pH refers to the concentration of free hydrogen ions (H+) and that pH buffers are created by weak acids and bases which donate or absorb hydrogen ions depending on their current concentration in the environment, i.e the current pH. Visualizing pH and pH buffersThe ability of a pH buffer to supply hydrogen ions when needed or absorb them when there are too much is best visualized as the water level in vertical tubes which differently shaped bulges that create reservoirs of varying capacity. The water level represents the pH and the size and location of that reservoir represents the buffer capacity which is a property of the solution and depends on the weak acids and bases present in that solution. When water is added the water level, as observed in a sight glass, for example, rises. The amount by which is rises depends on two things: the amount of water added and the diameter of the vertical tube at the current water level. The wider the tube the more water is takes to achieve the same water level change. This is very similar to pH in buffered systems. The water level is the pH and the diameter of the vertical tube is the buffer capacity of the system which depends on the current pH. Adding water is analogous to adding hydrogen ions (i.e. adding acids). Figure 1-A shows a system with a weak pH buffer which is buffered around a pH of 5. Once the water level is within the reservoir it takes a moderate amount of water to change the water level. When the level is above or below the reservoir it takes much less water to cause the same change of the water level. The same is true with pH buffers. Once the buffer is “broken” it's ability to consume or donate hydrogen ions is exhausted and all the hydrogen ions added go directly towards changing the pH. This results in a dramatic fall in pH if a strong acid is added or a dramatic rise if a strong base is added. Note that in these models a falling pH means a rising water level. Figure 1-B shows a system that is buffered at the same pH as A but with a stronger buffer. The solution may for example contain a higher concentration of the pH buffering substance or there is simply more of that solution. At or around the buffered pH it takes the addition of more water (i.e. acid) to move the pH by the same amount as in example A. Figure 1-C has the same buffer strength as A but at a higher pH. At the current pH is is not buffered at all and it takes very little water to change the pH. Application of the modelTitrationTitration is a process in which known amounts of a strong acid and/or base are added to a sample and the resulting pH change is recorded. That pH is then plotted over the amount of acid equivalents that were added (strong acid) or neutralized (strong base). This reveals where and how strong the sample buffers its pH. In our model adding acids or bases is equivalent to adding or draining known amounts of water, respectively. In section A only little amounts of water need to be drained for the pH to rise and the H+ level to fall. Once the level is in section B the pH change for the same amount of water drained is much smaller and the curve flattens out until the buffer capacity of the substance is exhausted. At this point the pH once again changes easily when only little amounts of a strong base are added. Actual titration curves will have smooth and gradual transitions as opposed to the corners shown in this simplified model. Measuring AlkalinityAlkalinity is the pH buffer capacity of water and it is measured by adding a strong acid until the sample's pH is 4.3. At that point virtually all carbonate and bicarbonate has been converted to carbonic acid and CO2 and the amount of acid added is a measure for the water's bicarbonate and carbonate content which buffer pH when present. In our model this means adding water until the water level represents a pH of 4.3. The amount of water added represents the “alkalinity”. From the examples shown in Figure 3 it is clear that the pH of the water does not indicate how well it is buffered. The system A shown in Figure 3 has a current pH of 8.0 but it is comparatively weakly buffered. System B has a lower pH (7.0) but is more strongly buffered and it will take more water (i.e. acid) to lower its pH to 4.3. Mash pH and AdjustmentsIn mash the malt is the dominant pH buffer not only because it represents the largest amount of pH active substances but also because the water's carbonate buffer has almost completely been exhausted at commonly found mash pH values. Combining pH active substances like malt, water salts and additional acid is equivalent to connecting tubes of various shapes that represent the pH characteristic of these substances. Figure 4 Brings together a grist that has a natural pH of 5.75 (pilsner malt for example) with high alkalinity water. High alkalinity means that this water can absorb a lot of free hydrogen ions from the malt. The result is a mash pH that lies between the pH of the water and that of grist. Since the malt is the more strongly buffered substance the resulting mash pH (6.0) is closer to the pH of the malt (5.75) than the pH of the water (7.0) rise in pH once both systems are connected, I.e. water and malt are mixed at dough-in. To lower this rather high mash pH, lactic acid for example, needs to be added. This equates to connecting yet another tube to this system. The tube for lactic acid has a reservoir that sits higher (higher hydrogen concentration, lower pH) than that of the malt because it’s buffer capacity is most efficient around pH 3.86. Once connected the Hydrogen ions from the lactic acid will drop the pH of the complete system, which is the mash and is now comprised of the water, the grist and the lactic acid, to a more favorable pH for mashing. |


