Vienna Malt Mash pH Surprise

Last weekend I brewed my annual Maerzen using 75% Best Malz Vienna, 20% Weyermann Munich II and 5% CaraFoam. When designing the brewing water I went by my past experiences with a similar grain bills that used Weyermann Vienna and the surprise came when I tested the mash pH. Instead of the expected 5.5o I got 5.77. I’m generally not off by that much and was doubting the pH meter until I also tested the mash pH with colorpHast strips. During the decoction the pH fell to 5.71 and I added another 2 ml 88% lactic acid to bring it down to 5.58, which I considered ok for a Maerzen. The boil pH was later reduced as well with some lactic acid.

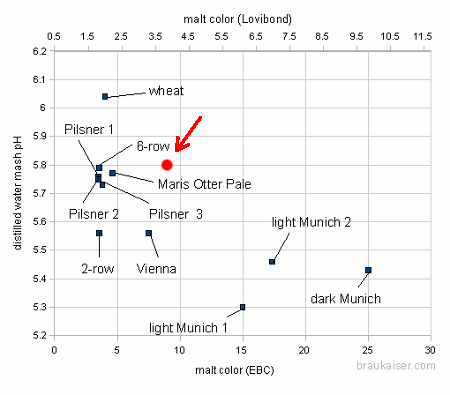
After testing the distilled water pH of this Vienna malt I found that is was way off from the pH one would expect from a base malt slightly darker than pilsner malt. It was 5.8. Below is a chart of the distilled water mash pH for various base malt samples that is taken from my mash pH paper:

The pH is slightly higher than pale or pilsner malts and more than 0.2 pH higher than the Weyermann Vienna that I tested a while back. This goes to show that the color/pH correlation is even weaker than I thought and that one should not rely on the accuracy of color based mash pH estimations for grists that contain a mix of base malts. The color based mash pH prediction works much better for grists made of pale/pilsner base malt and a mix of specialty malts since the pH properties of the latter are more predictable.

More predictable was the amount of lactic acid that I had to add to lower the pH. With 0.32 ml per kg and 0.1 pH drop it was well within the 0.25-0.42 ml range that I show here.

The malt analysis sheet for this batch of malt reported a pH of 5.9 for the congress mash. While I noticed this I assumed that the pH of the congress mash, which is diluted to 8 l/kg towards the end, would not be that useful for predicting mash pH. In hindsight this could have been an indication for the higher than expected mash pH.

Does gelatenized starch contribute to the measured mash extract content?

This is a question I was not able to answer in a recent BBR interview: Do the starches, that are present in wort but are not converted yet, contribute to the extract content that is measured with a refractometer?

So I set out to test this in a quick experiment. I mixed 6.5 g corn starch with 116 g water and heated that in the microwave until it boiled. The result was a gooey mass of gelatinized starch. When I tested this paste with the refractometer the line was very blurry around about 5 Brix. The total starch content was 5.3 % by weight. Based on that it seems that gelatinized starch does change the refractive index of a solution.

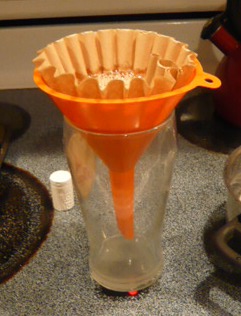
flitering the cold mash to obtain amylase enzymes but no additional starch

To get this solution more liquid and a clearer refractometer reading I had to add amylase enzymes. The easiest way to get them for a brewer is to make a cold malt extract. This means making a cold water mash and filtering it. The resulting wort had a extract content of about 1.6 Plato and I added 76g of this wort to the gooey starch mass which lowered its temp to ~60 C. Almost instantly the viscosity dropped and the solution became liquid.

If you do the math the resulting solution contains has about 3.8 % w/w solids. Immediately after mixing the solution tested at 3.2 Brix but 6 min later it tested at 3.6 Brix, which is about 3.7-3.8 Plato and close enough to the expected extract content while still showing a positive, albeit reduced, iodine reaction. I did not wait for the iodine reaction to completely disappear.

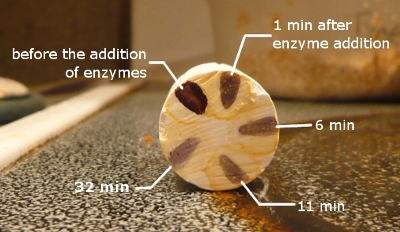
iodine test results after different rest times

This experiment shows that gelatinized starch also contributes to the mash extract that is measured with a refractometer.

The difference to an actual mash is that in an actual mash not all the starch is pulverized and immediately mixed with all the mash water as it was in this experiment. A lot of starch is inside grit particles and it takes time for this starch to be released into the sweet wort or to be converted inside the grit particles and for the resulting sugars and dextrins to diffuse into the wort. The starch present in the wort is converted within 20-30 min but there is a continued release of sugars into the wort which causes the increase in mash extract content that can be seen even after the iodine test is negative.

Brewing water spreadsheet update

I decided to give my brewing water calculator a face lift and also add some new features that brewers were looking for. The face lift happened mostly on the “basic” page, which is now more intuitively grouped into the sections for

  • base water
  • mash and grist info
  • salts and acids
  • resulting water profile and mash pH prediction

These are other things I changed or added:

  • changed the treatment of undissolved chalk such that it only contributes half its calcium since it contributes only half its alkalinity. Chalk’s solubility in mash seems to be limited and what does not dissolve and contribute to a rise in alkalinity should not contribute calcium ions either.
  • salt additions can now be made in g and mg/l. You can select the unit
  • the salts to be added can be reported in g and tsp. The latter is useful if your scale breaks down or you don’t own one yet.
  • lactic acid and phosphoric acid are supported. Are there many brewers who are actually using hydrochloric or sulfuric acid? I may add support for those later.
  • water boiling for alkalinity reduction has been added to the “advanced page”. This was easy to add since I already supported lime treatment
  • pH shift estimation for the major water treatment steps
  • salts can be added to all the water or strike water only. If they are only added to the strike water, the resulting water profile for the strike water or the overall water can be reported.

But a number of features remained the same:

  • The basic and advanced pages are still there. Anything entered in the basic page will automatically carry over into the advanced page. The idea is to support a wide variety of users.
  • the tall and narrow formatting remained in order to better support its use on mobile devices
  • I avoided macros or the use of fancy functionality in hope that this spreadsheet can be supported by mobile devices
  • the SRM based mash pH prediction is still there. Compared to some tests I’m running with grist based mash pH prediction, it does surprisingly well and is actually more accurate in most cases.
  • support for SI and US units. Under the hood it uses SI units almost exclusively. There is a spreadsheet version that is preloaded with US units even though this changes only 2 fields.

The new Kaiser_water_calculator.xls can be found in the Ingredients section on my site.

If you find bugs or have suggestions for improvements let me know here or send e-mail to “kai at braukaiser dot com”.

Follow-up on the Doppelbock yeast vs. no yeast in bottle experiment

Some may remember the experiment where I added life yeast to a few bottles of last year’s Imperator, my Doppelbock. I posted the rather pronounced flavor difference when I tasted 2 bottles side-by side here.

Tonight, about 1 year after they have been bottled, I opened another pair of these bottles.

The beer from the non-yeasted bottle still has a pronounced dark fruit aroma whereas the beer from the yeasted bottle has a much more subdued aroma. It seems to be catching up since I remember even less aroma at the 6 month tasting. In this beer some of the roasted character is coming though which is overpowered by the other aromas in the non-yeasted beer.

Quite dramatic this time was the difference in head retention. While it took the yeasted beer only 6 min until the head collapsed to a thin layer of bubbles. The head of the non-yeasted beer lasted about 4 min longer. This could be attributed to the release of protease-A by the yeast. This enzyme is known to degrade head retention positive proteins in beer.

As for the difference in taste, it follows the difference in aroma. The non-yeasted beer has a decidedly  fuller and more complex taste than the yeasted beer. Without having experienced the difference side-by-side I would consider the yeasted beer a great Doppelbock but it is not as good as the one that was bottled without the yeast.

Conclusion: I stand by my opinion that yeast gets in the way of the proper development of the flavor profile of a Doppelbock and brewers should avoid bottle conditioning this beer.

Conversion progress in a single infusion mash

This was my contribution to the most recent Basic Brewing Radio / BYO listener experiment. It was also the first time that I was able to contribute.

When brewing my most recent KaIPA, I took iodine tests and mash gravity readings during the mashing process. The grist consisted of

  • 90% Bairds Pale Malt
  • 4% Weyermann CaraMunich I
  • 6% Weyermann Munich II

Mash temperature was 68 C at a mash thickness of 3.5 l/kg and a mash pH of 5.45. The mash was stirred before a sample was taken.

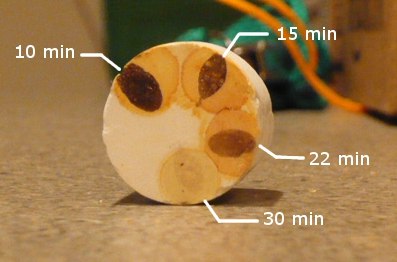
This is the progression of the iodine test:

At the 30 min mark I considered the iodine test negative.

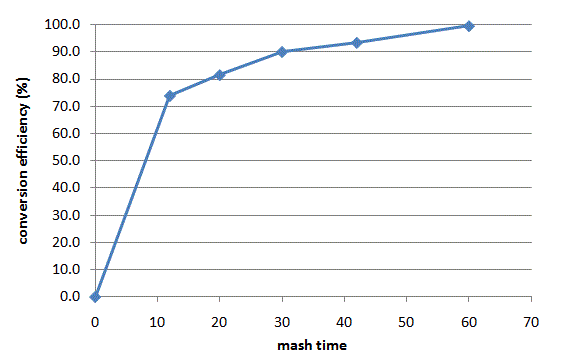
The progression of conversion efficiency looked like this:

After 30 min, when the iodine test was negative, only 90% of the extract potential of the grain had been released into the mash’s sweet wort. If I would have run-off at that point efficiency into the kettle would have suffered about 8-9% (conversion efficiency needs to multiplied with the lauter efficiency if efficiency into the kettle is needed). Mashing another 30 min gave me the additional 10% extract potential from the grain.

To what extent the attenuation was still changing after 30 min I don’t know. But I assume that there wasn’t much change happening due to the relatively high mash temp which denatures the beta-amylase more quickly.

Basic Brewing Radio on mash conversion and iodine test

I had the honor to join James, Chris Colby and Zot O’Conner in a Basic Brewing Radio show that discussed the results of a listener experiment on mash conversion time.

Triggered by Chris Colby’s comment that mashes convert in as little as 10-15 a listener experiment was conducted for which listeners had to record the progression of the iodine test and, if possible, the sweet wort extract content in the mash.

The result is what I have been observing on my own batches and in experiments: a negative iodine test (no starch or large dextrins present) is not necessarily an indication that the mash is done. Even after a negative iodine test the extract content in the sweet wort keeps increasing which is an indication that there is continued release of sugars and dextrins into the wort. If the wort would be lautered too early the efficiency into the kettle might suffer.

The experiment was also a good insight into how different brewers conduct the iodine test. Most are using the iodine solution in undiluted form which makes it difficult to tell if the color is coming from a reaction with starch or large dextrins or is coming from the iodine itself. I recommend diluting the iodine solution with rubbing alcohol (1 part iodine solution like iodophor, Lugol’s iodine or providone iodine and 9 parts rubbing alcohol).

Basic Brewing Radio: March 3, 2011 – BYO-BBR Conversion Experiment (iTunes|Streaming mp3)

About pH Targets and Temperature

I noticed that the topic “At what temperature should mash pH be measured” comes up once in a while.  Just recently I had an e-mail and an on-line discussion with a fellow home brewers on the same subject.

Fact is that the pH of a solution changes with temperature. It is caused by a change of the dissociation constants of the various acids/bases that are in the solution. Even water is considered an acid since it can donate hydrogen ions, although in most cases it is not dominating pH at all. The extent of the change depends on the substance. By the same mechanism even the pH optimum of enzymes may shift with temperature it is also dependent on the ionization state of the acids in the protein. I believe that the 0.35 correction factor for mash temp (65 C) vs. room temp (25 C) pH contains both the aspect that the actual pH in the mash is lower at 65 C compared to 25 C and that the pH optimum of the amylase enzymes shifts a bit from the value that can be observed by room temperature mashing.

But none of this matters since by convention pH values in brewing are reported as the pH of a room temperature sample. This arises from the laboratory practice of cooling pH samples before pH is tested. While pH meters can correct for temperature and their probes may be able to withstand higher sample temperatures, testing only cooled sample extends the life of the probe. This common practice also means that reported pH optima and pH ranges are for room temperature samples even though the actual reaction happens at higher temperatures. A.J. deLange mentioned to me the “by convention” aspect which is an important argument in this discussion. “By convention” means that we could do it differently but we settled on this particular method in order to communicate our observations and recommendations more clearly.  Just as an example, another brewing measurement where we have a convention is the expressing the extract content in specific gravity. Rather than Plato, which measures the extract content by weight and which is something that doesn’t change with temperature, specific gravity does change with temperature and we assume that all those measurements are corrected for temperature such that they apply to a 68 F sample. The practice is and should be done for pH measurements. To be exact you’ll have to cool hot samples and warm cold (e.g. beer) samples.

It’s also helpful to take into account how we arrived at these pH optima/ranges. They are determined by conducting a series of mashes (at correct mash temp for that enzyme) with differing pH. The pH is tested in a room temp sample. The amount of product produced during these reactions (sugar, for example) is then plotted over this room temperature pH.

The same is true with boil pH recommendations where kettle boils at different pH values were done to determine how wort quality changes when the boil pH changes.

One problem is that hardly any author is explicit about this. I assume that most of them see it as a given that they talk about pH from room temperature samples. Briggs was the only one I found that made a distinction. This lack of explicitness, if this is a word, seems to cause a lot of confusion with home brewers.

As for the origin of this confusion, I believe that early home brewing literature and publications are to blame. John Palmer’s 1st edition of “How to Brew” states this:
“When you mash 100% base malt grist with distilled water, you will usually get a mash pH between 5.7-5.8. (Remember, the target is 5.1-5.5 pH.)”

In this sentence he mixes room temp and mash temp pH values. The 5.7-5.8 base malt pH is correct when seen as the pH of a room temperature mash sample while the 5.1-5.5 pH target is only correct when seen as a mash temp pH target with a conversion factor of 0.35. With the correction the room temp sample pH target range is 5.45 – 5.85, which is more correct.

The pH optima that John cites for various enzymes seem to be mash temp pH values. He doesn’t quote a source but the only source that I found which lists mash temp pH values is Briggs’s Brewing Practice and Science book. In this he also gives room temp pH numbers.

I came across this inconsistency when I started reading more technical brewing literature. The pH optima listed for the enzymes for the given optimal mash pH ranges just didn’t line up with what I heard from other brewers. It took me a while and doing my own pH vs. conversion experiments to get a clearer picture of this topic.

And to answer the question that is most interesting to brewers, I believe that the optimal mash pH range is 5.3-5.5 for light beers and 5.4-5.6 for darker beers when testing a room temperature sample of the mash. This pH range is a good compromise between optimal enzyme activity, good boil pH and good cast-out wort pH.