How much effect does repeated foaming have on head retention?


Many articles about foam stability,
like this BYO article for example, mention that foaming during beer production can hurt the head
retention of beer. The explanation is that foaming consumes the
foaming compounds in the beer. I wanted to see if I can demonstrate
this with a simple experiment.

I took two 500 ml PET soda bottles and
filled each with about 300 ml of 1 C carbonated beer using a beer gun
like device. The beer was batch A from the Kraeusen Experiment. Both
bottles where then purged of air by squeezing and closing them once
all air was squeezed out. To fill the head space with CO2 and provide
the same storage conditions for both beers both bottles where shaken
up once. After that they were stored in a 8 C fridge. The control was
not shaken anymore but the “shaken” beer was shaken 3-4 times a
day over the next 3 days. Each time the foam was allowed to fall back
into the beer before it was shaken up again. Including the initial
shaking, which was also done for the control, the “shaken” beer
foamed up 10 times. This is 9 more than the control.


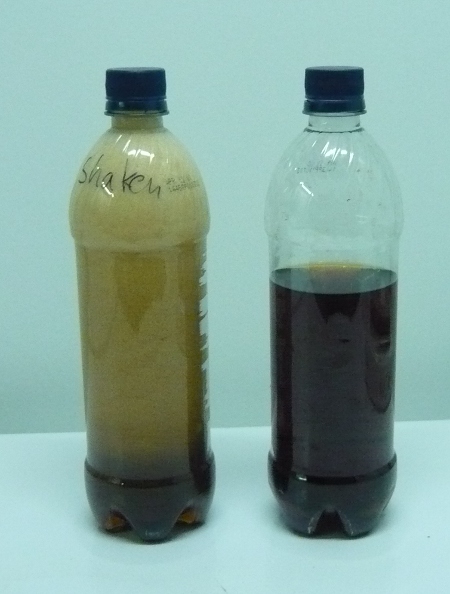
Shortly after shaking up the "shaken" sample.


On the 4th day, after the
foam has settled completely I filled the beer into 4 Koelsh glasses
(2 for the control and 2 for the “shaken” beer) using a funnel
that was held about 12 inches above the bottom of the glass. Each
glass was filled until the foam reached the upper rim of the glasses.
A timer was started when the first glass was filled. “shaken 1”
was done filling at about 5s, control 1 was done at about 12s,
control 2 was done at about 20s and “shaken” 2 was done at about
25s.


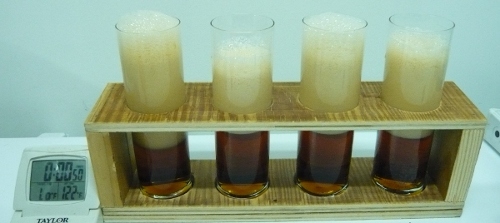
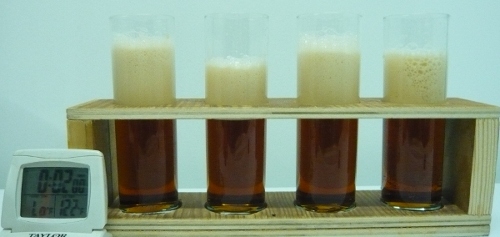
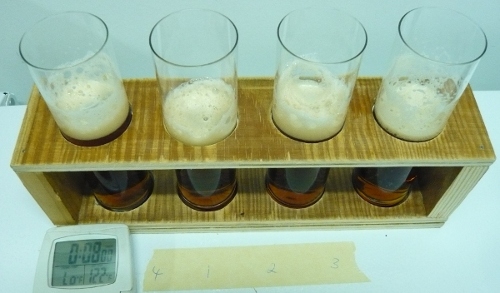
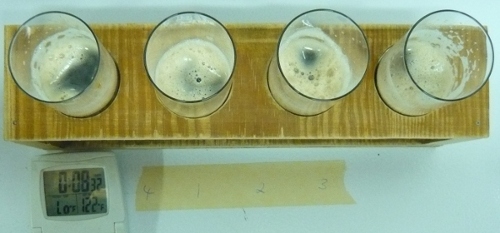
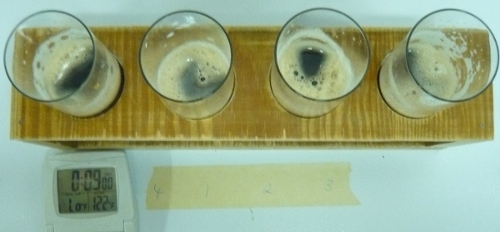
Here are images I took while the foam
was collapsing.

Shortly after the glasses were filled. The two glasses on the left are the "shaken" beer and the 2 glasses on the right are the control. The order of filling them was 2, 3, 4, 1 with 1 being the left most sample and 4 the right most.

2 minutes into the experiment

After 8 min. All samples appear to have the same amount of head left. The numbers in the lower section of the picture indicate the order in which the glasses were filled. 

 Looking onto the top of the beer. In all samples the surface of the beer starts to show.


 After 9 minutes the foam in all samples receded to a point where beer is visible.


For both beers it took about 8-9 min
until some beer showed through the foam when looking into the glass
from the top. There was no significant difference in foam stability
between the two beers. The same was true for lacing. While this
method of evaluating foam stability is not as precise and repeatable
as the ones performed by beer analysis labs, it is good enough to
provide an objective assessment of the foam stability of a beer
using.


Conclusion

I'm not saying that foaming does not
affect foam stability at all but I was not able to demonstrate this
using this simple experiment. It is possible that other factors play
a role or that the effect is too small to be detected with such a
crude approach. But for now, I would not worry about heat retention
being reduced noticeably when the beer happens to foam during the
brewing process.

Should the Kraeusen fall back into the beer?


Common brewing advice in American home
brewing is to let the Kraeusen fall back into the beer after primary
fermentation finishes. Very few brewers question this advice.
However, all the German books I have read about brewing and some
American home brewing books state that the bitter gunk on top of the
Kraeusen should be removed. If it is allowed to fall back in the beer
it will impart a harsh bitterness. As a result I have always
fermented in 5 gal carboys and removed the Kraeusen through blow-off.


In order to find out how much taste
difference that makes I set out to conduct an experiment. I brewed
two batches of my Altbier. Both were fermented in buckets. On the
first batch I allowed the Kraeusen to fall back into the beer. In
fact I helped it a little towards the end since I needed to rack the
beer before it was completely fermented. This however should not
invalidate the results since most brewers leave the beer in their
carboys well past the end of primary fermentation and until all
Kraeusen has fallen back. For the second batch I skimmed the brown
gunk off the Kraeusen regularly.


Both batches finished fermentation
during a maturation phase in a corny keg before they were moved to 4
C to settle the yeast and precipitate haze. Since they were still
cloudy after 2 weeks I added 3.5 g (½ pack) dissolved gelatin to
each keg which helped clearing the beer.


The following table outlines the
brewing process used for both beers:


A

B

water

Duesseldorf water profile

RA = 112 ppm as CaCO3

grist

89% Franco Belges Light Munich

10% Weyermann CaraMunich I

1 % Weyermann Carafa special III

water/grist ratio

4 l/kg

mash

63 C – 30 min

65C – 20 min

72 C – 40 min

76 C – 15 min

63 C – 45 min

65 C – 25 min

72 C – 40 min

76 C – 15 min

wort fermentability

(limit of attenuation)

75%

76%

mash pH

5.25

(0.18 ml 88% lactic acid per liter strike water was added)

5.21

(0.18 ml 88% lactic acid per liter strike water was added)

hops

1.9 g/l

6.8 % Hallertau Hallertauer Tradition

added 5 min after boil started

1.88 g/l

6.8 % Hallertau Hallertauer Tradition

added 5 min after boil started

boil time

60 min

boil pH

5.38

5.3

cast out wort pH

5.51 (?) *)

5.2

wort chilling

copper coil immersion chiller to ~30 C

ice bath to 12 C

yeast

WY 1007 grown from slant

~2.2 g yeast slurry to each liter of wort

WY 1007 grown from a small sample of batch A

~2.9g yeast slurry to each liter of wort

Starting extract

11.2 Plato

Primary fermentation temperature

16 C

Kraeusen removal

No

Yes

Primary fermentation

length

10 days

7 days

Maturation temperature

13 C

Maturation time

4 days

6 days

Cold conditioning time

4 weeks

3 weeks

Fining

0.2 g/l gelatin

Final Extract

2.8 Plato

Attenuation

75%

75%

Residual fermentable extract

0%

1%

Beer pH

4.31

4.18

 *) that pH value doesn't make sense to me. It should not be higher than the pre-boil pH and not that much different from the pH for batch B. But I did take the pH measurement on a sample of wort that had been standing unpitched for 24 hrs as opposed to the batch B post boil pH which had been taken the same day.


Both batches were fermented in buckets. A clear pot lid kept contamination out and provided easy access to the Kraeusen. The picture shows the batch A. The opening in the blue bucket lid was later enlarged to allow regular Kraeusen skimming for batch B.


The beer was partially naturally
carbonated during maturation and then force carbonated during cold
conditioning. The carbonated beer was bottled straight from the cold
conditioning kegs.

I presented the beer as a double blind
(participants didn't know the difference ) triangle test to 7 club
members. Only 3 were successfully able to tell the difference. Those
who were able to separate the beers correctly reported the following:


A

B

– weird aftertaste

– strong aftertaste

– “caramelly” aftertaste

– cleaner after taste

– cleaner beer

– preferred by tasters

I was very surprised how few were able
to tell a difference which appears so clearly to me. So I poured
myself 3 triangle tests and have to admit that I only got 2 correct.
Though I knew what to look for it wasn't as easy to keep the beers
apart since the lingering bitterness of A seems to stick with one for
longer enough to affect the taste of the next beer.


While this was a double blind triangletasting at a club meeting it was fairly unorganized. I didn't not get to start before many of the participants already had other beers. The setting was also not as quiet and free of distractions as one would expect for a taste testing.


The difficulty to differentiate the
beers in blind tasting may explain why some brewers, who have tried
this experiment before, found no difference and thus claim that it
doesn't matter if the brown Kräusen gunk is removed or not. The type
of beer may also play a big role. I can imagine that a hop dominated
highly bitter IPA may not show the difference or may even provide a
case where the beer, which didn't have the Kraeusen removed, is
preferred. Having done this experiment and tasted the difference I'm
convinced that the Kraeusen needs to be skimmed or blown off for any
German style beer. The type of harsh and lingering bitterness, which
I experienced in A, is considered a flaw even in the more bitter
German styles like Northern German Pils and Altbier. The bitterness
should be clean and linger only little. When it fades in the after
taste is should never reappear later. The only German beer where I
had this happen to me was Oettinger Pils which is one of the cheapest
beers you can by there.


The results are in line with similar experiment reported in Zymurgy. The article can be
read at the AHA forum.


When I sat down for lunch today I had 2
bottles of this beer and thought I poured the good one. After taking
the first gulp I noticed that I got the wrong one. To me the taste
was so bad that I poured it down the drain and poured the other beer
which I was able to enjoy. I'll likely only finish beer B and pour
out beer A.


Conclusion


Removal of the bitter Kraeusen gunk
makes a difference in the quality of the beer even though it may not
be detected by all brewers. The outcome of this experiment is enough
to suggest that interested brewers try this on their own to see if it
can improve the quality of their beers.


updates:

(1) to make up for my own failure to pass 3 triangle tests with this beer I set up a different taste test tonight. I took 12 identical glasses. 6 were filled with batch A and 6 filled with batch B. I then asked my wife to set up a random line of all 12 glasses. Taking my time and cleansing my palate with bread and water I went though each glass and took one to two sips to determine which beer it was. In the end I was able to separate them precisely based on both their hop taste and lingering bitterness. It shows that if I take my time I'm able to tell them apart reliably. 


(2) 1 month after the initial taste
testing I brought samples to a club meeting and was surprised to see
that the difference, which was very clear to me earlier, has aged
away to some extend. Knowing what to look for I was still able to
taste a difference but at this point I would not be surprised if
others can't tell them apart.


Differences in Efficiency Calculations

This is a blog entry I have been thinking about a while. How precise is the ppg (points per pound and gallon) based efficiency calculation really. The reader should see this as something that is interesting to know and more of an exercise in using Plato and sg rather than something that any brewer needs to worry about

When calcylating efficiency (American) home brewers usually use:

(1) Eff = 100 * (gravity points of wort * wort volume) / (grain weight * grain extract potential)

Wort volume is given in gallon, grain weight in pound and extract potential in ppg. But that's not how efficiency is actually defined. It is defined as the ratio between the extract weight in the kettle vs. the extract potential of the grain:

(2) Eff = 100 * extract weight in kettle / grain extract potential

The grain extract potential is simple. It is its weight multiplied with the extract content determined in the laboratory mash. For most base malts it is about 77% (80% dry basis extract and 4% moisture content). Going forward I will call the grains extract potential "e". The weight of the extract in the kettle is a bit more complicated. For that we have to look at the Plato scale. Many brewers know degree Plato as another way of expressing wort strength. To be exact: the wort strength in Plato is the ratio between the weight of the extract dissolved in the wort and the the total wort weight:

(3) P = 100 * extract weight in kettle / wort weight in kettle

Extract weight in kettle is what we need for (2) but I still need the wort weight weight in the kettle. For that I simply remember that sg (specific gravity) is nothing else than the density of the wort in kg/l. It follows that the wort weight in kg is the product of wort volume in l and its specific gravity:

(4) extract weight in kettle = sg * wort volume in kettle

Now I can calculate the actual efficiency by using (2), (3) and (4). First some clean-up and shorter notatons for the variables:

  • Eff_ppg = Efficiency calculated using gravity points and ppg for extract potential
  • Eff_% = Efficiency calculated using Plato and extract % for grain extract potential
  • P = wort strength in Plato
  • sg = wort strength in specific gravity (1.xxxx)
  • GP = wort gravity points ( = (sg – 1)*1000)
  • V_l = wort volume in liter
  • V_gal = wort volume in galon
  • m_kg = grain weight in kg
  • m_lb = grain weight in lb
  • e_% = extract potential of the grain in %
  • e_ppg = extract potential of the grain in ppg

With that the two efficiencies are:

(5) E_ppg = 100 * GP * V_gal / (m_lb * e_ppg)

(6) E_% = 100 * sg * P * V_l / (m_kg * e_%)

Grain lab analysis results don't show the extract as ppg but as percent of dry weight. To get the ppg equivalent I need to find a formula that calculates e_ppg from e_%. Since it is assumed that both efficicncy calculations (5) and (6) are equal I can set them equal:

(7) E_ppg = E_%

Now the busy work. They both use weight and volumes but in different units. That will be fixed by assuming these conversions:

(8) V_l = V_gal * 3.78
(9) m_kg = m_lb * 0.45

For simplicity I'll be using the simplified Plato to sg conversion. I'll later discuss how much that makes a difference.

(10) P = GP / 4 = (sg – 1) * 250

After putting all this into (5) and (6) I end up with this huge equation:

(11) 100 * (sg – 1) * 1000 * V_gal / (m_lb * e_ppg) = 100 * sg * (sg – 1) * 250 * V_gal * 3.78 / (m_lb * 0.45 * e_%)

Luckily this can be cleaned up considerably. V_gal and m_lb exist on both sides and fall out. So does (sg-1). All the constants can be consolidated into one. What's left is this:

(12) 0.476 / e_ppg = sg / e_%

solving this for e_ppg gives:

(13) e_ppg = 0.476 * e_% / s_g

This equation means that the extract potential in ppg depends on the grains extract potential in %, which is to be expected, and the specific gravity of the wort for which efficicncy is calculated. This was not expected. Here are a few examples. If sugar, which has an extract potential of 100%, is used to make a 1.040 sg wort it has an extract potetial of ~ 46 ppg. If it was used to make a 1.080 sg wort it has an extract potential of only ~ 44 ppg

The same is true for a base malt with 80% dry basis extract and 4% moisture. The actual extract content is 76.8%. If used for 1.040 wort its ppg extract potential is ~36.0 ppg. When used for 1.080 wort the extract potential is ~34.6 ppg.

As a final exercise lets look at a chart that plots the two efficies over the gravity of the wort. The wort volume is held constant while the grain bill is scaled such that the "%" based efficiency remains constant. In addition to that, the sg to Plato conversion is done using the officicial ASBC conversion formula which is a polynominal fit of their sg to Plato tables [deLange]:

(14) P = -616.868 + 1111.14 * sg – 630.272 * sg^2 + 135.997 * sg^3

While there are many similar formulas out there, this is the official one given by the ASBC (American Society of Brewing Chemists) and it should be seen as the standard.

This is the chart I came up with
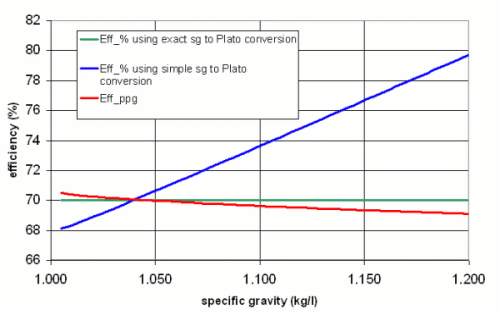
It plots 3 curves. "Eff_% using the exact sg to Plato conversion" uses (14) to convert between sg and Plato. It is constant at 70% because this formula is used to calculate the necessary grain weight for the given volume and specific gravity. "Eff_% using the simple sg to Plato conversion" uses (10) to calculate the sugar content (Plato) from the specific gravity. "Eff_ppg" calculates the efficiency using gravity points and an extract potential of 35.7 ppg.

Despite the existing discrepanacy and incorrectness of the ppg based efficiency calculation, which I discussed earlier in this text, it tracks very well with the actual efficiency of 70% over a wide range of specific gravities. The reson for this is simple: while I showed that technically the extract potential in ppg also depends on the specific gravity, I also simplified the sg to Plato conversion by using (10) instead of (14). Both errors compensate each other to some extend. This also becomes clear when looking at the efficiency which is calculated using the simple sg to Plato conversion. It already shows an error of ~4 percent point at a specific gravity of 1.100.

Conclusions

Does it really matter in brewing whether you use the ppg based forumla or the Plato based one? Not really. If you always use the same formula for efficiency calculation and subsequent recipe design it doesn't matter at all. It may matter when discussing and comparing efficiency with other brewers. In this case the ppg based approach is within 1% of the actual efficiency for all realistic gravities. That error, however, is too small to be a conern in home brewing. Using the % based efficiency calculation with a crude sg to Plato conversion, on the other hand, can overestimate efficiency significantly. Thus care needs to be taken when converting Plato or Brix readings into specific gravity readings. That is in particular true for high gravity worts.

One last word about ppg or "points per pound and gallon". It should be called "point gallons per pound" or pgp since it is an expression of how many "point gallons" (gravity points multiplied with gallons) one can get from one pound of grain, sugar, etc. Its actual unit is gal/lb. 

[deLange] A.J. deLange: Specific Gravity Measurement Methods and Applications in Brewing.
 

Undissolved vs. dissolved chalk in the brewing water

This was the first time that I compared
dissolved chalk against undissolved chalk in a 5-gal “production”
batch of beer. Up to this point I have only done small scale
experiments. Those experiments suggested that chalk dissolved with
CO2 would be twice as potent in raising the mash pH as undissolved
chalk is. As a result I new that I should cut the amount of chalk
needed in half when it will be dissolved with CO2.

To brew the Schwarzbier I used the
following grist. This is my standard recipe for a Schwarzbier:

  • 53% Pilsner malt

  • 40% Munich Type II malt

  • 4% CaraMunich III malt

  • 3% Carafa I special

The water was prepared from reverse
osmosis water by adding the following salts. Version A uses
undissolved (i.e. suspended chalk) while version B used dissolved
chalk

salt beer A beer B
Table salt (NaCl) 25 ppm 25 ppm
Epsom salt (MgSO4*7H2O) 40 ppm 40 ppm
Magnesium chloride (MgCl2*6H2O) 50 ppm 50 ppm
Baking soda (NaHCO3) 40 ppm 40 ppm
Chalk (CaCO3) 200 ppm 100 ppm

The resulting profile was calculated as
follows. Note that I do have an old analysis of the reverse osmosis
water which I included in the calculated mineral profile:

ion beer A beer B
calcium 85 ppm *) 45 ppm
magnesium 11 ppm 11 ppm
sodium 26 ppm 26 ppm
sulfate 17 ppm 17 ppm
chloride 38 ppm 38 ppm
alkalinity as CaCO3 144 ppm 144 ppm
residual alkalinity as CaCO3 77 ppm 105 ppm
residual alkalinity in dH 4.3 5.9

*) There is some ambiguity as to how
much calcium is actually contributed by undissololved chalk since it
contributes only half its alkalinity potential, it may also
contribute only half its calcium. These results assume that the chalk
contributed all its calcium. The result is a lower residual
alkalinity compared to the water with only half the chalk but
dissolved.

The salts were then weighed. For beer
A, they were mixed into the strike and sparge water. Since the chalk
was not dissolved the water remained cloudy. Water treatment for the
strike water was done in the mash kettle.

For beer B the salts were added to 2
liter soda bottles and reverse osmosis water was added. Then the
bottles were carbonated with a carbonator cap. Once sufficiently
carbonated the water cleared overnight which was a sign that the
chalk got dissolved. This water was then added to the remaining
reverse osmosis water for mashing and sparging. The mash water was
prepared the night before to allow residual CO2 to escape. No chalk
precipitated during that time, There was also no precipitation of
chalk during the heating of the strike water or the sparge water.

The resulting pH values during the
brewing process are shown in the following table. All pH values were
measured with a sample cooled or heated to 25 C

process step beer A beer B
initial mash pH (63 C) 5.6 5.68
dextrinization rest (72 C) 5.51 5.61
mash out (76 C) 5.5 5.54
kettle full (pre-boil) 5.62 5.62
cast out wort (post boil) 5.66 5.56
after 7 days of fermentation 4.41 4.45

For both beers the pH dropped during
mashing which I contribute to the continued release of acidic
compounds from the dark specialty malts. One oddity is that for batch
A, which used undissolved chalk, the kettle full pH is lower than the
cast out pH. Generally the pH falls during boiling. This is something
worth paying attention to in future batches although it may also have
been a measurement error. The initial mash pH of batch B is greater,
which supports the fact that the residual alkalinity of its water
should have been higher. This is the case if all the calcium added by
the chalk is considered for undissolved chalk as it was done in the
aforementioned water analysis.

I have not yet done a final tasting
with these two beers. But preliminary tasting of both batches during
their fermentation and conditioning did not show any significant
differences

Conclusion:

To achieve roughly the same mash pH,
only half the chalk is needed when it is dissolved with CO2.

Decoction vs no decoction on a Dunkel


After last year's Maibock, this is the
2nd experiment where I compared a beer brewed with
decoction mashing and a beer brewed with infusion mashing.


This time I wanted to see if there is a
more pronounced flavor difference if the majority of the grist was
composed of highly kilned base malts. This is one type of grist for
which decoction mashing is still fairly common in Germany. test test test . So I chose
a basic Dunkel recipe and the brewing process is outlined after the
mash diagram for the 2 beers (click the diagram for a larger version).


Dunkel II

Dunkel III

Grist

99% Best Malz Dark Munich

1% Weyermann Carafa Special II

99% Best Malz Dark Munich

1% Weyermann Carafa Special II

Mash

Hochkurz infusion mash

63C (145F) for 30 min

hot water infusion

70C (158F) for 45 min

thin decoction boiled for 3 min

75C (167F) for 15 min

Intensified double decoction:

35C (95F) for 30 min

pulled 60% mash as decoction

slowly heated

70C (158) for 60 min (it didn't want to get iodine negative)

slowly heated

35 min decoction boil

returned decoction to main mash

63C (145F) for 40 min

pulled thin decoction; 5 min boil; returned

70C for 20 min

hops

0.48 g/l Hallertau Magnum (12% a-acid) added before start of
boil and boiled for 60 min

0.48 g/l Hallertau Magnum (12% a-acid) added before start of
boil and boiled for 60 min

boil

60 min; 9% boil-off

60 min; 8% boil-off

yeast

WY 2206; raised in 10l 2 Plato wort wit constant aeration

harvested from Dunkel II

primary

pitched at 9C (48F)

fermented 8 days at 10C (50F)

pitched at 8.6 (47F)

fermented 11 days at 10C (50F)

maturation

11 days at 15C (59F)

18 days at 15C (59F)

cold conditioning

8 weeks at 1 C (34F)

4 weeks at 1C (34F)

aging

6 weeks at 10 C (50F)

6 weeks at 10 C (50F)

stats

OE: 12.8 Plato

attenuation limit: 71%

attenuation: 67%

attenuation delta: 4%

AE: 4.2 Plato

pH: 4.25

OE: 12.0 Plato

attenuation limit: 76%

attenuation: 69%

attenuation delta: 7%

AE: 3.7 Plato

pH: 4.28

It should be noted that the Dark Munich
malt caught me by surprise and the mash for Dunkel II resulted in a
rather unfermentable wort (attenuation limit 71%) which was
compensated for during the mash of Dunkel III (see longer maltose
rest). As a result the wort for Dunkel III was more fermentable. But
both beers finished with a similar attenuation (67% and 69%). The
poor fermentability was attibuted to the enzymatic weakness of the
Best Malz Dark Munich which took a long time to convert (see the 40
min 70C rest of the decoction) and showed similar attenuation
problems in subsequent beers.

3 ½ months after brewing Dunkel
II and 3 months after brewing Dunkel III I tasted the beers
side-by-side. It should be noted that at the time of this tasting I
was not aware that I brewed one with decoction and the other one
without. I had brewed quite a number of other beers in between and
actually forgot how I mashed these beers and thought that they were
both brewed with decoction until I checked my notes.

Dunkel II (left) and Dunkel III (right) 


Dunkel II

Dunkel III

aroma

– sweet Munich malt character

– hint of roast present

– but not as strong as Paulaner Dunkel

– same as Dunkel II

appearance

– dark mahogany color

– tan head

– slightly more hazy than Dunkel III

– slightly more head retention than Dunkel III

– same as Dunkel II

– except less haze and slightly less head retention

taste

– malty sweet start

– finishes with dark malt character and a hint of roast

– slightly less sweet than Dunkel II in its start

– the finish is slightly less malty

– hit of roast present

mouthfeel

– fuller than Dunkel III

– slightly less full than Dunkel II


As you can see I did notice differences
berween the beers but it is difficult to tie them to the decoction
alone. I contribute the better clarity, lower head retention and
thinner mouthfeel of the more intensely mashed Dunkel III to the
stronger protoelytic activity in the mash. Its increased sweetness
stems from the larger amount of residual fermentable sugars (see
attenuation delta) compared to Dunkel II. I even considered Dunkel II
(the non-decocted, more precisely only 3 min thin decoction boil) to
be the more malty of the two beers.


Conclusion: This experiment was
not as conclusive as the Maibock experiment and I would even call it
inconclusive. There were too many differences between the analytic
parameters (in particular the attenuation numbers) of the two beers
to tie their slight taste differences to the more intensive mashing
(including a 35 min decoction boil) of the Dunkel III. A future
experiment needs to increase the decoction boil time to 60 min and
attempt to keep the original extract, attenuation limit and
attenuation and fermentation the same.


(Comments have been disabled due to
spam being posted. Please send comments and questions to kai at
braukaiser dot com)

Cold Water Sparging

This is an experiment that I wanted to try for a while: Sparge a mash with cold instead of hot water.

Based
on my understanding of the lauter process sparging with cold water should have no or only little
impact on the efficiency if all the sugars, that will be dissolved, are
dissolved during the mashing process. While a colder sparge could slow
the speed of the run-off by causing the wort to be more viscous and
flocks of coagulated protein be smaller it should not affect how many
sugars are left behind. Especially in batch sparging where there is no
concern about channeling through the grain bed.

I decided to give
the cold water sparge a try on one of my Schwarzbier recipes. But since
I also wanted to change the grain bill slightly it is not a true
side-by-side where only the temperature of the sparge water changed.
Here is what I did for the two beers:


Schwarzbier IIIa

Schwarzbier IIIb

water

85 ppm Ca, 11 ppm Mg, 25 ppm Na, 17 ppm SO4, 38 ppm Cl, 175 ppm
HCO3

RA: 74 ppm as CaCO3

85 ppm Ca, 11 ppm Mg, 25 ppm Na, 17 ppm SO4, 38 ppm Cl, 175 ppm
HCO3

RA: 74 ppm as CaCO3

grist

63% Pilsner

30% Munich II

4% CaraMunich III

3% Carafa II

53% Pilsner

40% Munich II

4% CaraMunich III

4% Carafa II special

mash

63C; 30 min; pH = 5.48 (cold
sample)

heating at 1 C/min

70C for 50 min

heating at 1 C/min

76C for 15 min

63C; 30 min; pH = 5.44 (cold
sample)

heating at 1 C/min

70C for 50 min

heating at 1 C/min

76C for 15 min

sparge

single batch sparge

11 liter 75C (170F) water; the 2nd runnings
started to run bright after recirculating

single batch sparge

11 l 15C (60F) water; the 2nd runnings never
cleared up

efficiency

conversion: 98%

lauter: 89%

into kettle: 89%

post boil and chilled in kettle: 89%

conversion: 99%

lauter: 88%

into kettle: 86%

post boil and chilled in kettle: 88%

hops

0.87 g/l; 60 min; Hallertauer Trad. 6.8%

0.65 g/l; 20 min; Hallertauer Trad. 6.8%

1 g/l; 60 min; Hallertauer Trad. 6.6%

0.68 g/l; 20 min; Hallertauer Trad. 6.8%

boil time

60 min

60 min

starting extract

13 Plato

13 Plato

yeast

WLP 830; actual pitching rate unknown. All the 17l of wort were
pitched with that yeast.

WLP 830; maybe 30-40 ml sediment to 6l wort. Remaining 11l
were pitched after 24 hrs.

cellar

primary: 11 days at 10C (50F)

maturation: 3 days at 12C (54F)

cold conditioning: 3 weeks at 0C (32F)

primary: 7 days at 10C (50F)

maturation: 3 days at 12C (54F)

cold conditioning: 4 weeks at 0C (32F)

stats

attenuation limit 80%

actual attenuation: 78.5%

final extract: 2.8 Plato

attenuation limit 79.2%

actual attenuation: 78.5%

final extract: 2.8 Plato


The things to note is that the conversion efficiency was very high on both batches. Almost all of the extract potential was realized in the mash which is an indication for good and complete mashing. The lauter efficiencies (percentage of dissolved extract that made it into the kettle) for both beers were very similar and as a result the efficiencies in the kettle were very similar as well. The differences that can be seen are easily within measurement errors.

This shows that a cold water sparge does not necessarily lower your efficiency. 

It should also be noted that the 2nd runnings, which were the cold runnings, never cleared up. The remained hazy throughout the sparge. 

Tonight I tasted the beers. Here are pictures that show the color and clarity of the beer


And the taste notes:


Schwarzbier IIIa

Schwarzbier IIIb

aroma

– slightly roasty

– otherwise clean

– slightly roasty by less than IIIa

– slight sweetness in aroma

appearance

– dark mahogany color

– dark mahogany color. a little less than IIIa

– slightly hazier than IIIa

head retention

– seems a little less stable than the head of IIIb

– slightly more stable

taste

– sweet start

– followed by slight roast

– low bitterness that lingers only briefly

– sweet start

– followed by slight roast

– low bitterness that lingers only briefly

mouthfeel

– medium (compare to standard Pils)

– slightly fuller than medium

The cold sparged beer is definitely a slightly more hazy than the hot sparged version. This may actually have been the result of the cold sparge although I don't have a solid explanation for this. If the haze results from an increased protein content it may also explain the slightly better head retention and fuller mouthfeel.

Conclusions:

  • Cold sparging does not have strong adverse effects on efficiency and beer quality
  • when a mash-out is performed it has no apparent effect on the fermentability of the wort. I don't know if this is still the case when no mash-out is done.
  • it may make the beer more prone to haze
  • it does not really save time since the wort at the end of the lauter will be colder and require more time to be heated to boiling temperatures
  • it can save the need for a pot for heating the sparge water
  • Since the spent grain temperature is lower at the end of a cold sparge less energy is wasted.

While this was an interesting experiment I don't plan to repeat it in the near future. At this point I don't see any benefit in this practice except for cases were I forget to heat the sparge water.


(comments are disabled b/c
of problems with spammers. Send your questions and comments to kai at
braukaiser dot com)


Fast Ferment Test

I have to start pushing this
test more. It seems as if it provides an answer to one of the most
common brewing forum questions: Why is my FG higher than expected?
Interesting enough, most of the very experienced American home brewers
don't use this test either. Might be that their process is refined
enough that the information given by this test is just redundant. But especially for beginning homebrewers, this test can provide invaluable information regarding the FG that can be expected. Almost as important ad taking an original extract (OG) reading. To many of them are just hung up on the attenuation numbers that are given for the yeasts at White Labs and Wyeast. When I asked them about the procedure that is used to get these numers, they told me that they don't even use a standard wort for all the yeasts.

I
certainly swear by it. How else can you find out if you met your
targeted fermentability during mashing before the beer fermentation is
done. It has become very important to brewing lager beers as they seem
to slow down significantly towards the end with a risk of being to
sweet before going to lagering temps. But even with Ales this test is
useful as it actually allows me to take residual fermentable sugar in
the beer into account when calculating priming sugar additions.


How much alkalinity does 1 ppm of CaCO3 (Chalk) really add?

A few weeks back I decided to write another brewing water calculation spread sheet. The formulas were mostly taken from the literature and existing spread sheets. Then I decided to add a cation (positively charged ions) to anion (negatively charged ions) balance check just to see if the water profile that I created made sense. This is when I noticed an imbalance when creating brewing water from scratch by using distilled water and salts. The resulting water should not show an imbalance and every cation should have matching anion. But it was showing an imbalance when chalk was used. So I gave the fomulas used for chalk a closer look.

 And found that 1 mol (a unit that is proportional to the amount of molecules/ions of a particular substance) of CaCO3 was assumed to add one mol of bicarbonate to the water. And that in most spreadsheets and calculators the bicarbonate contribution was later used to calculate the alkalinity as CaCO3. But that didn't seem right. If CaCO3 adds only one bicarbonate, it also needs to add one hydroxyl ion (OH-):

(1)  CaCO3 + H20 -> Ca2+ + HCO3- + OH-

Since this would liberate hydroxyl the pH of the water would need to rise. If that is not happening then chalk can also be dissolved in the presence of CO2

(2)   CaCO3 + H2O + CO2 -> Ca2+ + HCO3- + HCO3-

In this case each mol of chalk would add 2 moles of bicarbonate. Yet another reaction is possible in the presence of acid and free protons

(3)  CaCO3 + H+ -> Ca2+ + HCO-

(4)  HCO- + H+ -> H2O + CO2

If neither of these reactions hapen the chalk won't dissolve. And that is clearly happening in brewing: If you add chalk to the brewing water it just turns the water cloudy and it will eventually settle. 

But does it really matter if the chalk dissolves or not? No. Because the bigger picture is that we added the chalk to give the water+chalk mixture more "alkalinity" I.e. acid buffering capacity. That acid buffering capacity is needed to reach a targeted mash pH once the malt, and with it acid buffers, has been added. At that point reactions (3) and (4) can take place. Whichever reaction is happening (1)..(4), chalk can neutralize 2 equivalents of acid and for all intents and purposes 1 ppm of chalk should therefore raise the alkalinity by 1 ppm as CaCO3. 

But that is not what most water treatment spreadsheets assume. They assume that 1 mmol/l CaCO3 adds 1 mmol/l HCO3- (bicarbonate) which drops one negative charge on the floor and caused the imbalance that I noticed. And then they go ahead and convert the ppm HCO3- to alkalinity as ppm CaCO3 by multiplying with the factor 50/60. In the end the addition of 1 ppm CaCO3 raises the alkalinity by only 0.5 ppm as CaCO3. This certainly seems wrong and I thought I had it all figured out until I decided to confirm this theory with an experiment.

The experiment is seemingly simple. Make small mashes with 3 different waters that are supposed to have the same residual alkalinity and test their pH. The first water (A) would be reverse osmosis water and serve as the control. The second water (B) would be reverse osmosis water with chalk and calcium chloride added such that the added residual alkalinity is 0 if the chalk contributes 2 alkalinity equivalents. The 3rd water (C) has chalk and calcium chloride added such that the added residual alkalinity is 0 if chalk contributes only one alkalinity equivalent. Whichever water that causes a mash pH to match the RO water mash pH the closest would have used the correct formula for alkalinity contributions by chalk. Here is a summary of the waters used:

  • water A: reverse osmosis tap water
  • water B: RO water + 80 ppm CaCO3 + 290 ppm CaCl2*2H2O; this increases the Ca2+ content by ~110 ppm
    • if 1ppm CaCO3 adds 1 ppm alkalinity as CaCO3 then the water's residual alkalinity (RA) increases by 0.0 over the RO water's RA
    • if 1 ppm CaCO3 adds 0.5 ppm alkalinity as CaCO3 then the water's RA decreases by 2.2 dH (German Hardness) or 40 ppm as CaCO3
  • water C: RO water + 150 ppm CaCO3 + 150 ppm CaCl2*2H2O; this increases the Ca2+ content by ~110 ppm
    • if 1ppm CaCO3 adds 1 ppm alkalinity as CaCO3 then the water's residual alkalinity (RA) decreases by ~4.4 dH or 80 ppm as CaCO3
    • if 1 ppm CaCO3 adds 0.5 ppm alkalinity as CaCO3 then the water's RA remains unchanged compared to the RO water

200ml of each water were taken and heated to ~64C in the microwave. Then 50g of crushed pilsner malt were added to each water sample and stirred in. The mashes were occasionally stirred and a 15ml sample was taken from each mash after 5 min and cooled to 22C when it was measured with a pH meter. The results were surprising:

  • mash A : pH = 5.76
  • mash B : pH = 5.69
  • mash C : pH = 5.77

According to these results the chalk added only 0.5 ppm alkalinity as CaCO3. And the pH shift for mash B is even in the range that would have been expected from the 2.2 dH RA drop. According to Kolbach the shift is 0.03 pH units for each dH which would be 0.066 and the results show ~0.07.

I couldn't believe it and started to ponder why that would be the case. Why is the added CaCO3 only neutralizing 1 equivalent of acid and not 2? Maybe it has something to do with the chalk not being dissolved.

So I conducted another similar experiment. This time between a control, water with suspended chalk and water with dissolved chalk. The chalk would be dissolved with CO2 which is brought into solution through shaking. Here is what I did. I added 0.24 g chalk and 0.88g calcium chloride to 1.5 l of reverse osmosis water. This is twice the salts added to water B in the previous experiment because I wanted to pronounce the effect of the residual alkalinity difference. I then shook this water and the added salts in a 2l soda bottle until the calcium chloride was dissolved. Immediately after shaking, without giving the chalk a chance to settle, I poured off 200ml for sample B. I then removed another 300ml in order to increase the head space. This headspace was then filled with CO2 and the bottle closed. When I started shaking the bottle, it immediately contracted which was a sign of the CO2 going into solution. After some shaking I let the bottle sit until the water became crystal clear again. This was not the result of the chalk settling but it being dissolved in the water. I then took 200ml of that water for samle C:

  • water A: reverse osmosis
  • water B: RO + 160 ppm CaCO3 + 580 ppm CaCl2*2H2O
    • RA = -4.4 dH or 80 ppm alkalinity as CaCO3 if chalk adds 1 alkalinity equivalent
    • RA = 0 dH or 0 ppm alkalinity as CaCO3 if chalk adds 2 alkalinity equivalents
  • water C: water B + CO2
    • RA = -4.4 dH or 80 ppm alkalinity as CaCO3 if chalk adds 1 alkalinity equivalent
    • RA = 0 dH or 0 ppm alkalinity as CaCO3 if chalk adds 2 alkalinity equivalents

I then heated both samples to 68C, added 50g crushed pilsner malt to each and rested (with occasional stirring) them for 10 min. After that I took 15 ml samples and cooled them to 20-21C:

  • mash A : pH = 5.67
  • mash B : pH = 5.47
  • mash C : pH = 5.66

So it appears that dissolving the chalk in the mash water changes its alkalinity potential. undissolved chalk has less alkalinity potential than dissolved chalk since mash B showed a much lower mash pH which could only have been the result of a lower RA than the 2 other mashes.

But why is this? Does not all the chalk dissolve in the mash as commonly assumed? And if yes why is that? And would it always be 50%? Shouldn't there be enough acid for this to happen via reactions (3) and (4)?

For now I don't have an answer to this. 


Batch Sparging – Making sense of the numbers

This weekend I took the time to take extensive
extract and volume measurements during a 2 sparge batch sparging
process here is the data and an analysis of that data:

  • grist weight 5.6 kg
  • total laboratory extract of that grist is  80% of 5.6 kg -> 4.5 kg
  • water added to mash: 15.5 l (cold)
  • extract of the first running in the kettle 22.5% (% extract is equal to Plato)
  • volume of the first runnings in the kettle 9.75l at 65C -> 9.6l (cold)
  • extract of the 2nd runnings: 11.75%
  • volume in kettle after 2nd running: 20l at 75C -> 19.6l (cold)
  • extract of the 3rd runnings: 7.4%
  • volume in kettle after 3rd running (pre-boil volume): 26l at 90C -> 25l (cold)
  • extract in kettle after 3rd running (pre-boil extract): 14.6%

The first analysis was for the extraction efficiency of the mash. The definition of extract percentages is:

(1)  E = 100% * m_extract / ( m_water + m_extract)

If
we want to know how much extract exist in a given wort of known extract
content that has been created with a known  amount of water we can do
this by rearanging (1) to

(2) m_extract = (m_water * E / 100%) / (1 – E / 100%)

(3) m_extract = (15.5kg * 0.225) / (1 – 0.225) = 4.5 kg

This
means that all of the extract available in the grain has been extracted
in the mash (100% extraction efficiency). This was confirmed by a
negative iodine test of the wort and the spent grain. I.e. no native
starch was left.

Since batch sparging was
used, a simple model can be used to calculate the lauter efficiency.
lauter efficiency * extraction efficiency is the brewhouse efficiency. 
For that model we need the amount of wort that is held back in the
lauter tun after each run-off. But this is not simply the amount of
water used for the mash minus the amount of first wort collected
because the volume of the wort increases when the extract is dissolved.
To get that volume we can use this formula which is the weight of
extract dissolved in a given volume of known gravity wort:

 (4) m_extract = ( E / 100% ) * SG * V_wort

SG is the specific gravity and it will be estimated with 1+E*0.004.Rearranged to V_wort we get

(5) V_wort = m_extract /  ((E/100%) * SG)

(6) V_wort = 4.5 kg / (0.225 * 1.090) = 18.3 l

This
means the 15.5 l water and 4.5 kg extract from the 5.6 kg grain made
18.3 l of 22.5% wort. 9.6l of that wort were collected after the first
run-off which indicates that 8.7 l are held back in the mash.

Batch
sparing is a process of successive dilution of the wort remaining in
the grain and running it off. This can be modeled mathematically and
has bee analyzed here. But since not all run-offs were of equal size, lets just calculate the efficiency step by step:

The first run-off will extract this percentage of the extract from the mash:

(7) Eff_1st = v_1st_runoff / (v_1st_runoff + v_wort_in_grain)

(8) Eff_1st = 9.6l / (9.6l + 8.7l) = 0.52 = 52 %

If
52% were recovered by the 1st run-off, then 48% of the extract are
still in the lauter tun. This extract is dilluted by the sparge water
and run off. The volume of the 2nd run_off is 19.6l – 9.6l = 10l and
the efficiency of that run-off is:

(9) Eff_2nd = v_2nd_run_off / (v_2nd_run_off + v_wort_in_grain)

(10) Eff_2nd = 10l / (10l + 8.7l) =0.53 = 53%

Using
this and the fact that the 2nd run-off was only able to draw from 48%
of the extract we can determine the combined efficiency from the 1st
and 2nd run off as:

(11) Eff_1st_and_2nd = 52% + 48% * 53% = 78 %

78%
of the extract are now in the boil kettle. This leaves 22% in the
lauter tun. With a 3rd run off size of 5.4 l we find the efficiency of
that run-off as

(12) Eff_3rd = 5.4 / (5.4 + 8.7) = 0.38 = 38%

and the combined efficiency of all 3 run-offs as:

(13) Eff_1st_2nd_3rd =  52% + 48% * 53% + 22% * 38% = 0.86 = 86%

This
means that with the given run-off sizes, number of sparges and amount
of wort left in the grain, an a lauter efficiency of 86% is to be
expected.

The actual efficiency into the boiler is the following:

(14) Eff_kettle = V_kettle * E * SG / (m_grain * 0.8)

the 0.8 represents the 80% laboratory extract of the grain.

(15) Eff_kettle = 25l * 0.146 * 1.058 l/kg / (5.6 kg * 0.8) = 86%

Since
the Efficiency is the product of extraction efficiency and lauter
efficiency and the extraction efficiency was determined to be 100%, the
actual lauter efficiency must have been 86%, which matches the
theoretical result very well. As a result no efficiency was lost due to
process inefficiencies and to increase that efficiency the following
process parameters could be changed:

  • more sparge water: this would lead to a larger pre boil volume and longer or stonger boils and may not be desired
  • less wort kept in the grain: This mash was done with conditioned
    malt which makes for a"fluffier" mash. Such a mash may hold more wort
    and I wonder if an unconditioned mash may result in less wort being
    held back and thus increasing the efficiency
  • equalize the run-offs: the boost expected from that is very low. Se here.
  • fly
    sparging: this method follows a different principle and should yield
    better efficiencies when done properly. But in addition to more time,
    it also needs a better lautertun which I don't have.

So, 86% for that beer is fine with me.


Weissbier Experiment – Different yeasts

This experiment was designed to evaluate different Weissbier yeasts. The following yeasts were used:

  • 351-1 (This yeast came from a WLP351 vial, but I think it is not the WLP351 strain anymore)
  • WY3068 – Supposedly the W68 strain from yeast bank Weihenstephan. A very popular strain among German brewers
  • WY3333
  • WY3056 – Initially a blend of yeast, but I cultured this one from a single cell colony


The wort was a simple Helles Weissbier wort:

  • 70% Weyermann light wheat, 30% Weyermann Bohemian Pils
  • Step mash (55 C for 30 min -> infusion of boiling water -> 65 C for 45 min -> thin decoction boiled for 10 min -> 72C mash-out)
  • 3.7g 10% Target and 7.5g 8% Northern Brewer hops boiled for 60 min
  • Boiled for 60 min in a 2 stage boil: 1st stage just a simmer, 2nd stage with a 12 %/hr boil-off. I wanted to see if that type of boil, which is done by many commercial brewers, actually works for avoiding DMS. No noticable DMS was later found in the beer
  • Cast-out wort: 16l @ 11.5 Plato

 4 one galon glass jugs were filled with 3l wort each. They were oxygenated with pure O2, but I did not take ones on how long (30s are likely). The following amounts of yeast were pitched

  • 351-1: 10 ml sediment, propagated from an agar culture
  • WY3068: 50 ml loose sediment from a Wyeast activator pack
  • WY3333: 35 ml thin slurry from a Wyeast activator pack
  • WY3056: 10 ml sediment propagated from an agar culture

It was noted that the pitching rates were rather different, but time and availability didn't allow for all yeasts to be grown the same way to the same amounts.

The yeast was pitched at 18C and since all growlers sat in the same water bath, it was assumed that they would have the same temperature. The temperature measured is the temperature of that water bath and because of the good heat conductivity the actual fermentation temperature was not expected to be different.

Over the next 2 days the temperature rose to 21C (70F) before it fell down to 20 C. The 2nd day after pitching the following extract values were measured:

  • 351-1: 7 Plato
  • WY3068: 6.5 Plato
  • WY3333: 6.5 Plato
  • WY3056: 6.0 Plato

Alongside the primary Fermentation, a number of fast ferment tests were done:

  • dry bread yeast (1/4 tsp to 150 ml) : 2.5 Plato
  • dry bread yeast (1/2 tst to 150 ml) : 2.5 Plato
  • WY3056 : 2.5 Plato
  • WY3333 : 2.6 Plato

The beers were bottles with residual extract. This means that the beer was simply filled into bottles once the extract level reached 3.7 – 3.8 Plato, which leaves enough residual fermentable extract to properly carbonate the beers. A practice called Gruenschlauchen in German Brewing.

During bottling a strong banana aroma was noticed for WY3056 and WY3333.

After one month (I didn't get to it earlier) the 4 beers were tasted together:

WY3086:

The beer pours a very strong head and is well carbonated. It's aroma shows moderately yeasty notes with some sulfur. The taste shows a little of the Weissbier clove spiciness but hardly any banana even though the beer smelled like banana juice at bottling time. The final extract was 2.7 Plato.

WY3333:

The beer is highly carbonated. It's aroma is yeasty with some banana/bubble gum character. But that fruit was very strong and came out later when the head subsided. The taste shows a restraint spiciness but no fruit. It is also a little yeasty, but more in a good way. Final extract 2.7 Plato. 

351-1:

The beer was not as well carbonated as the others and didn't pour a strong head. This is odd since this yeast is actually able to ferment below the 2.6 Plato of the other beers and was bottled with at the same extract level as the other beers. As a result more fermentable sugars must have been fermented that should have resulted in more CO2. The aroma spots some solvent notes (ethyl acetate). Later, the aroma is more clove dominated. It's taste is more spicy than all the other ones with less yeasty character. Final extract 1.6 Plato (!!)

WY3056:

The beer is highly carbonated. The aroma is clean initially, but once the head fell it showed a slight yeasty character. The taste is bready-yeasty (in a good way) without any signigficant spiciness. This character might make this yeast ideal for a Dunkles Weissbier. Final extract 2.8 Plato.