For a while now, actually ever since I got the microscope, I have been keeping track of yeast growth in starters, fast ferment tests and some beer fermentations. In some cases I was too lazy and did not record any data. But what I found is that the new growth per gram of extract (stuff dissolved in wort), measured in Billion per gram, was all over the place. Initially I thought I could come up with a simple formula to estimate cell growth based on wort volume and extract content. But that doesn’t seem to be the case.
So I started examining the issue in a more controlled environment. For my first set of experiments I prepared 6 l of ~10 Plato wort from old malt extract and some left over wort I had in the freezer. This was frozen in three 2 l soda bottles. I then grew some WY2042 from a slant to use in these experiments. WY2042, Danish Lager, works well since it doesn’t flocculate when its done fermenting. To conduct the experiment I would thaw one of the bottles with wort and keep it in the fridge. I then take ~230 ml of that wort innoculate it with yeast and place it on a stir plate covered with foil. The initial cell count was determined with a hemocytometer and the yeast was allowed to complete fermentation for 1 to two days. Then the final cell count is taken and the sample is allowed to settle in the fridge. For the next experiment some of the yeast sediment is kept in the flask and fresh wort is added. The amount of wort added is recorded as well as the initial cell count. Using this approach allows me to run a series of experiments with yeast of consistent freshness and only one stir plate. To eliminate age effects I went back and forth over the starting cell density range of 1 through 270 Million cells per ml. In the chart below you see Billion cells per liter, which is the same.
Here are the results: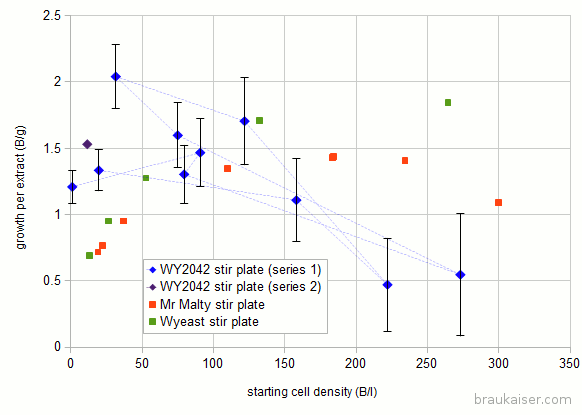 For reference I also added numbers I got from Jamil’s and the Wyeast pitching rate calculator. The dashed lines show which experiment provided yeast for the next experiment.
There are notable differences at low and high starting cell densities. In my experiments the specific growth I got at high starting cells counts (>150 B/l) was much less than the two pitching rate calculators predicted. The low growth makes sense since more sugar will be needed to feed the larger population during its lag phase. I think that this might be more pronounced with older yeast cultures where glycol reserved are lower (these yeast cultures sat only 1-2 days between propagation).
I also saw larger than expected growth at low starting densities.
Around initial densities of 100 B/l, the experimental results agree with the other two calculators which is good and means that there is some predictability.
You also see one data point for a 2nd series of the experiment. In that series I started a new culture from a slant and want to see if it behaves similarly.
The error bars get lager for higher starting densities since the error for counting the initial population plays a larger role when that population is large. E.g if the starting population is 1 Billion and has an error of 10% (+/- 0.1 Billion) and the final population is 100 Billion with a 1o% error (+/- 10 Billion) the error for the new growth of 99 Billion is ~ 10% or +/- 10 Billion. But if the starting population is 101 +/- 10 Billion and the final population is 200 +/- 20 Billion the difference is still 99 but with an error of +/- 22.
Stay tuned for more data as I have it ready for publishing.


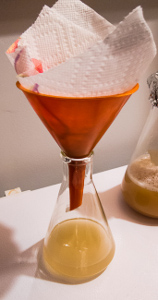
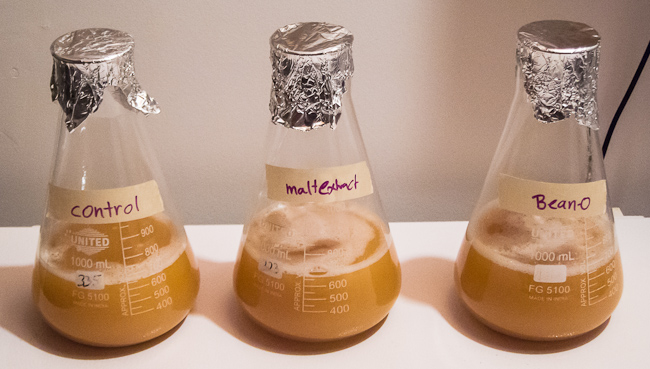
 Simply decant the spent starter beer until left with yeast sediment and stir bar. This works best with strains that floculate well. Weissbier yeast, for example doesn’t settle into a dense sediment and you’ll loose some slurry during decanting or have to leave a fair amount of starter beer in the sediment.