Yeast Growth on Malt and Sugar

Yet another experiment I did a while back. I wanted to see how yeast growth is affected by the ratio of malt extract and corn sugar. The motivation was not to find a way to save on the amount of malt extract needed for starters but to get an idea of how much yeast growth depends on the nutrients that are in wort in addition to the wort sugars.

Setup

Wort and a glucose (corn sugar) solution both with with an extract content of 10.6 Plato were prepared. Both solutions were mixed to yield growth media containing 100%, 75%, 50% and 0% malt extract. They were inoculated with WY2042 at a rate of about 0.3 B/g (billion cells per gram of extract or sugar).

This experiment was repeated with the addition of 3% DAP (diammonium phosphate as percent of extract weight) as an additional nitrogen source.

All starters were done under these conditions:

  • ambient temperature: ~20 C
  • volume: ~250 ml in a 500 ml flask
  • stirred and covered with foil

Results

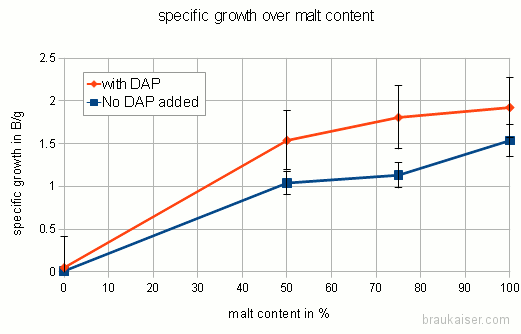
The following chart shows the yeast growth as billion new cells per initial extract (malt extract and added glucose)

Yeast growth over malt content in starter wort

Yeast growth over malt content in starter wort

With and without the added nitrogen there is a steady increase in yeast growth as the percentage of malt in the stater wort is increased. Pure sugar solution, even with the added nitrogen, did not yield any significant growth which is likely due to other nutrients (vitamins, trace elements) that are found in wort. The addition of nitrogen boosted the yeast growth, however, yeast growth was still limited by the malt content and an increase of the latter also increased yeast growth in the presence of additional nitrogen.

The added nitrogen (3% of extract+sugar weight) was about the amount needed to grow 1.5 Billion new cells per gram of extract/sugar if these assumptions are made:

  • yeast biomass formula: CH1.61O0.56N0.16 (source)
  • dry cell density: 20 B/g
  • DAP molar weight: 132 g/mol

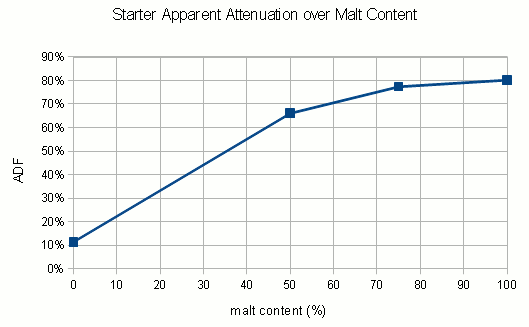
Another interesting observation was the attenuation levels that each of the no DAP starters achieved:

Starter Apparent Attenuation over Malt Content

Starter Apparent Attenuation over Malt Content

The low attenuation of the all sugar starter is likely due to the virtual absence of growth in that starter. That resulted in a small yeast population which was not able to consume much of the sugar it had available. These starters were fermented for about 2 days. But even the 50% and 75% malt starters had lower attenuation than the 100% malt stater. That’s surprising since the apparent attenuation limit of the 50% malt starter is about 100% and the yeast population should have been large enough to completely consume all available sugars.

Conclusion

All malt wort provides vital nutrients for yeast growth. When these nutrients are diluted with sugar overall yeast growth suffers. The addition of additional nitrogen in the form of DAP (diammonium phosphate) can compensate for the reduced level of nutrients. But even with plenty of added DAP the best yeast growth was seen in all malt worts.

Yeast Growth Over Roasted Malt Content in Starter Wort

This experiment accompanies Yeast Growth in Hopped Wort and it examines the effect that roasted malts have on yeast growth. I did this experiment about a month ago but haven’t found time to write about it until now. The result was that roasted malts do have an impact on yeast growth but it is unclear if that’s due to less fermentable sugars or the inhibitory effects of the melanoidens.

Setup

Just like the hopped wort experiment I prepared 500 ml purely DME based wort and 500 ml DME+carafa wort. For the latter 40 g DME and 40 g Carafa II special (ground to a powder) were boiled with water. The resulting wort was filtered and adjusted to 10 Plato extract content.  An extract potenial of 75 % was assumed for the carafa. That means that the resulting wort is equivalent to wort from a grist with ~43% carafa II and ~57 % pale malt.

To create worts with increasing amounts of Carafa both worts were mixes as follows:

  • 100 DME wort: no carafa
  • 67% DME wort + 33% Carafa+DME wort: equivalent to about 15% Carafa in the grist
  • 33% DME wort + 67% Carafa+DME wort: equivalent to about 28% Carafa in the grist
  • 100 Carafa+DME wort: equivalent to about 43% Carafa in the grist

The mixed worts were inoculated with about 2 ml WY2042 yeast slurry. The counted cell density was 0.15 B/g extract. All starters were 250 ml wort in 500 ml flasks and left open while on the stir plate.

For this experiment the resulting yeast was not filtered and dried.


Results

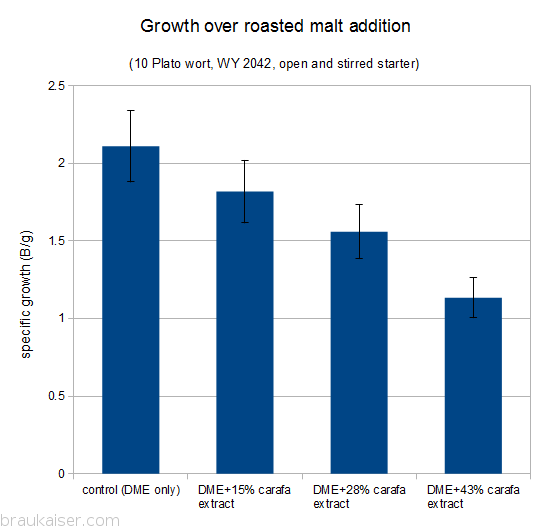
The results are shown below.


Yeast growth over roasted malt content

Yeast growth over roasted malt content

There is a clear relationship between roasted malt content and resulting yeast growth: the more roasted malt the less yeast was grown per extract.

Conclusion

At roast malt levels found in most dark beers (10 % or less) the impact on yeast growth is expected to be minimal and such worts should be suitable for yeast propagation. Extremely high levels of roasted malts should be avoided as the impact on yeast growth can be significant.

The experiment did not asses whether the reduced yeast growth was due to reduced fermentability (roasted grains provide less fermentable extract)  or the inhibitory effect that melanoidens are known to have on yeast metabolism.


Yeast Growth in Hopped Wort

In this experiment I looked at the influence that iso-alpha acids have on yeast growth. This was motivated by curiosity and the fact that there are a number of brewers, like me, who are using leftover wort from brewday for future starters.

Setup

For this experiment I prepared 500 ml of unhopped wort and 500 ml of heavily hopped wort. Both worts had an initial extract content of about 11 Plato. The hopped wort was boiled for 30 min with the addition of 4 g of German Magnum (13% alpha acid) pellets. The unhopped wort was also boiled for the same amount of time.

According to the Tinseth IBU model the hopped wort should have 290 IBU, but it is likely that the actual IBU number is less due  iso-alpha acid solubility and or isomerization limitations.

By mixing these two worts starters with increasing bitterness were created ranging from

  • 100% unhopped wort
  • 67% unhopped and 33% hopped wort
  • 33% unhopped and 67% hopped wort
  • 100% hopped wort

All starters were inoculated with 4 ml of yeast slurry from the same yeast culture. The initial cell density was estimated as 0.05 B/g, which is fairly low. All starters were left open and stirred at 20 C.

Yeast dry weight was determined by filtering a known amount of well suspended yeast in starter beer through 1 micron nominal filter paper. The filtered beer was clear which means that all yeast was held back by the paper. The paper and yeast was then dried using a microwave until all water was removed from the yeast. The paper and dried yeast was the weighed using a balance scale with a resolution of 0.01 g.


Results

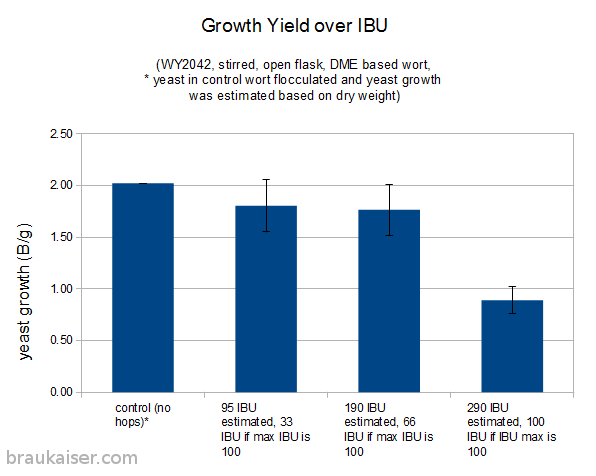
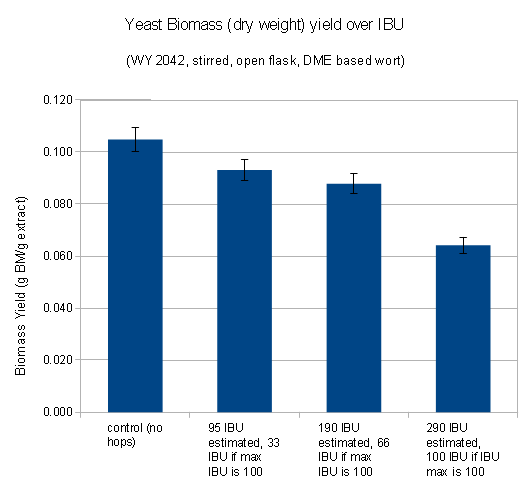
The chart below shows the growth as B/g for the 4 different starters


Yeast growth over starter IBU levels

Yeast growth over starter IBU levels


Because the yeast in the control flocculated and made counting difficult its yeast count was estimated using the dry weight of a filtered amount of suspended starter assuming 20 Billion per gram.  I’m fairly confident that this is correct since the the yeast from the 33% and 65% hopped wort starter both had a dried yeast cell density of ~ 20 B/g which also matches previous dried yeast measurements for WY 2042.

Yeast from the 100% hopped wort starter showed with 14 B/g slightly less cells per dried weight but the overall yield in yeast biomass was still less than the yield in less hoppy starters.

Biomass Yield Over IBU

Biomass Yield Over IBU


When looking at the biomass yield there is a constant decline as the IBU level of the starter wort is increased.

Conclusion

While hopped wort has a negative effect on yeast growth it is only significant at very high hopping levels. Thus the use of Pale Ale, Pilsner and even most IPA worts for brewing yeast propagation should not pose any problems. Very highly hopped worts may show a noticeable decline in yeast growth and are thus less well suited for yeast propagation.

NHC 2013 presentation

My presentation at the NHC today was very well received. Yeast growth in starters does interest a lot of brewers and I had a lot of new data to present. Now that I finished the presentation I can devote more time on experiment documentation here on braukaiser.com.

A copy of the presentation can be found here.

Starter Wort Gravity and Yeast Growth

This is an experiment I conducted a few weeks ago. It examines the effect that the starer original gravity has on yeast growth. Only yeast growth and viability based on methylene blue staining were examined.

Experiment Setup

For this experiment a 20 Plato wort was prepared from DME and inoculated with a culture of WLP 036 (Duesseldorf Altbier) at a rate of about 0.04 B/g. After inoculation and thorough mixing the wort was divided into four 500 ml flask. Each flask received about 100 g of the 20 Plato wort. To 3 of the 4 flasks additional water was added. The amount of water added was 100 g, 200 g and 300 g, respectively.

Results

Yeast Growth

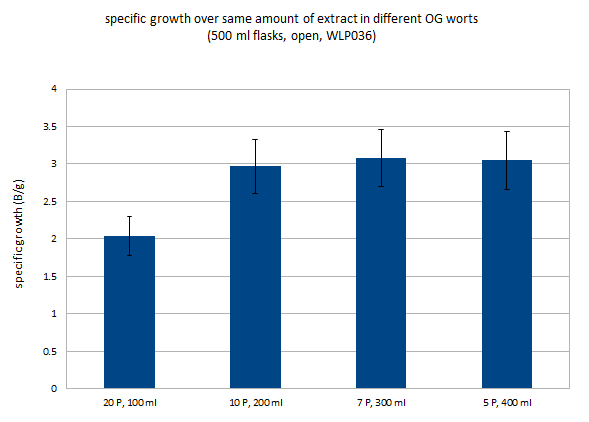
The following chart plots the specific growth in Billion per gram of extract (B/g) for the 4 different experiments. WortOGAndYeastGrowthWhile the 20 P/100 ml experiment was able to develop the best vortex due to the lower wort level, it’s growth was significantly less than that of the other experiments with lower gravity and higher wort levels.  Yeast growth saturates at 3 B/g but from this experiment it is not apparent if this limitation is caused by the culture’s access to air or another limiting nutrient. That other limiting nutrient could be nitrogen.

During propagation hardly any vortex was visible in the 5 P/400 ml starter due to a volume that approached the capacity of the flask (500 ml) yet it still showed the same growth as the 10 P/ 200 ml experiment where the vortex was able to draw in more air. A previous experiment (Stir Speed and Yeast Growth) showed yeast growth changes as the stir speed and with it the size of the vortex changes. However, this experiment was done with a different yeast (WY2042) and the yeast used here (WLP036) may hit maximum growth in wort with lower oxygen uptake than WY2042.

Culture Viability

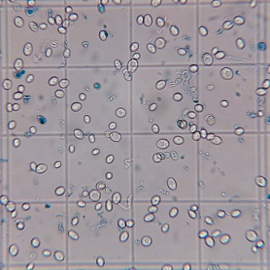
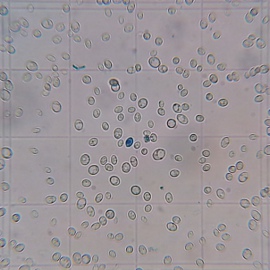
When the growth yeast populations were stained with methylene blue to asses their viability slight differences were noticeable.

20 Plato starter

20 Plato starter

10 Plato starter

10 Plato starter

7 Plato starter

7 Plato starter

5 Plato starter

5 Plato starter

Yeast grown in the 20 Plato starter showed a viability of about 90% while populations from the other 3 starters had close to 100% viability.  That was to be expected given the toxicity of high alcohol environments on yeast cells.


Conclusion

The experiment did not uncover much new information. It showed that high gravity worts but lower starter volumes to not result in the same amount of yeast growth compared to a lower gravity starter with more volume despite their potentially improved access to O2. Furthermore, the resulting higher alcohol concentration in high gravity starters is likely to reduce the viability of the culture.


Yeast Growth and the Question of Quality vs. Quantity

In the Fermentation Test for Starter and Air Access Experiment I showed results that suggested that quantity in yeast growth does not necessarily mean best fermentation performance. I repeated these experiments with a different yeast (WLP 036, Duesseldorf Alt) and a pattern seems to be emerging. Like WY2042, WLP036 is a poor flocculator, which makes cell counting easier. Unlike WY2042, it is an ale yeast.

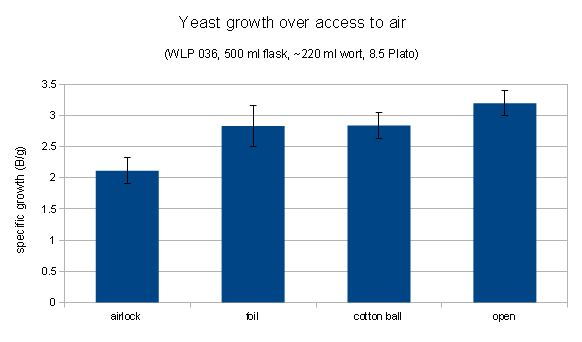
Below is a chart showing the specific yeast growth (Billion cells grown per gram of extract) plotted for 4 different starter configurations:

  • airlock, no access to air, except for what was in the head space
  • aluminum foil, loosely crimped
  • cotton ball to emulate a breathable stopper
  • open: no cover on the flask. This should be seen as best case for passive gas exchange but it is not necessarily practical for yeast propagation due to contamination concerns


Yeast growth over different propagation conditions

Qualitatively these results are very similar to the same experiment done with WY2042 as shown here. The open flask leads to an increase of about 40% over the airlock covered flask. But WL036  is able to grow more yeast per gram of extract compared to  WY2042. These are strain to strain variations that have to be examined in a different experiment.


Just like in the previous experiment the yeast grown in this experiment was used to ferment a high gravity wort. The original gravity was increased to 30 Plato (~ 1.130 sg) in order to increase the stress on the yeast. Just as before, the wort was prepared from dried malt extract (Briess extract light DME).

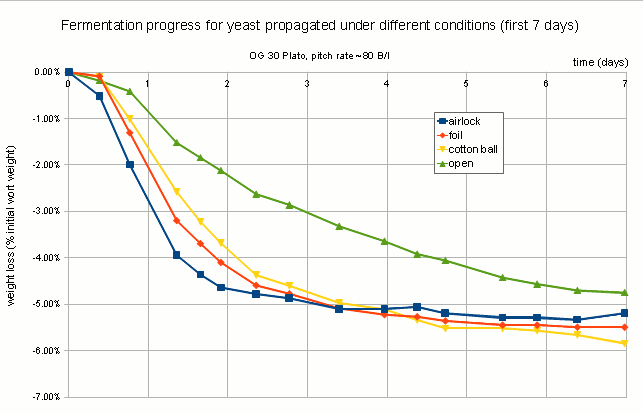
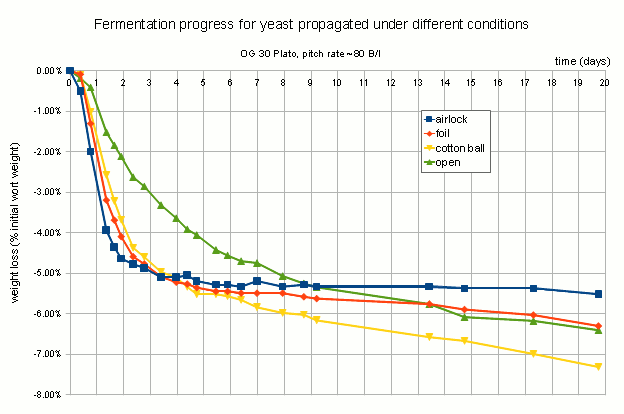
Once again the yeast with the least access to air took off the fastest as can be seen in the following plot of weight loss over the first 7 days:

Weight drop during the first 7 days of the fermentation test

But this time fermentation slowed down significantly well before the 80% attenuation limit of the wort. Based on the weight drop fermentation slowed down significantly at about 40% ADF (Apparent Degree of Fermentation). This time all the fermentation experiments were conducted in 500 ml flasks covered with an air lock. This does seem to lead to a better correlation between weight loss and attenuation.

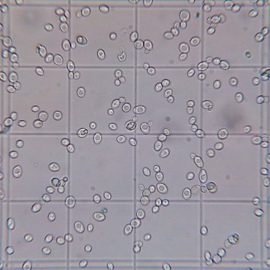
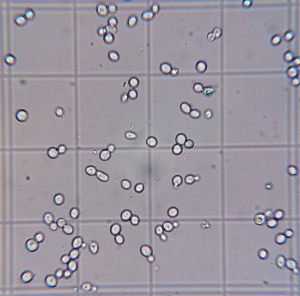
On day 6 a refractometer reading was done on all 4 experiments and the result correlated with the weight loss at that time. In addition to the refractometer reading the health of the yeast population was assessed with methylene blue staining and all 4 yeast populations. The “airlock” yeast population showed about 10% lower viability (more stained cells) compared to the other 3 populations which showed virtually no stained cells:

WLP036_airAccess_day6_airlock

Micrograph of a methylene blue stained yeast sample from the “airlock” fermentation test 6 days after pitching the yeast. About 10% of the cells stained with MB.

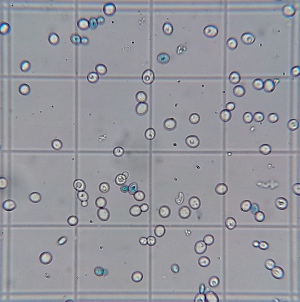
WLP036_airAccess_day6_foil

Micrograph of a yeast sample from the “foil” fermentation test stained with methylene blue at day 6 after pitching. The “cotton ball” and “open” experiments also showed virtually no stained cells.


During an additional 2 weeks of fermentation, the yeast propagated with air lock cover remained stalled at about 5% weight loss while other yeast populations were able to pull ahead, albeit much slower than they did during the first 4 days.

WLP036_airAccess_21days

Weight loss during 21 days of fermentation

After 21 days the yeast covered with a cotton ball during propagation is showing the most attenuation so far.

The comparatively poor performance of the yeast grown with an open flask, which showed the most growth per initial extract, points to the conclusion that more growth during propagation is not necessarily better. At this point I suspect 2 mechanisms that could be at work here

  1. yeast propagated with an open flask has access to too much air and as a result becomes less efficient at working in a completely anaerobic environment. If this is the case yeast companies should not propagate yeast in aerobic environments, yet they do.
  2. While more oxygen during yeast growth allows for more growth, the amount of available nitrogen is limited. As a result yeast gown at a high growth rate without supplemental nitrogen will be nitrogen deprived which largely affects their protein level. This may lead to less efficient metabolism thus the slower fermentation rate that was observed.

I suspect that it is the reduces nitrogen level that causes the yeast poorly during the initial phase of fermentation. To test that I plan to repeat this experiment with the following 4 yeast propagation conditions:

  • airlock covered
  • airlock covered + DAP (diammonium phosphate) as an added nitrogen source
  • open
  • open + DAP


Fermentation Tests for Starter and Air Access Experiments

After I conducted the Access to Air and its Effect on Yeast Growth in Starters experiment I also started fermentation tests with that yeast. The tests were designed to stress the yeast during a high gravity wort fermentation that would show differences in the yeast’s fermentation performance. However, it did not show a clear correlation between the yeast’s access to air during propagation and its fermentation performance. It did however show a difference in final yeast viability which suggests that stressing the yeast with an even higher gravity fermentation could show a correlation between yeast propagation and fermentation performance.

 Methods and Materials

1 day after the yeast propagation was complete the yeast had settled and the supernatant starter beer was decanted leaving behind a lose slurry of yeast. 3 ml of this yeast slurry was taken from each flask and added to amounts of 25 Plato wort (ranging from 276 to 280 g) in pint sized Mason Jars. The wort was unhopped and prepared from dried malt extract and water.  After being boiled for 10 min it was allowed to cool and was then filtered to remove hot break and most cold break.

Yeast was mixed into the wort using a stir plate and initial pitch rate was assessed through cell counts. The jar was then covered with a lid but not closed tightly to allow CO2 to escape. Each jar was shaken vigorously to aerate it. All of the fermentation experiments were weighed on a regular basis to keep track of the fermentation progress. Fermentation happened in a 20 C ambient temperature environment.

After 15 days of fermentation the apparent extract content was assessed using a hydrometer (0.990 – 1.020 range) and thermometer for temperature correction. The total cell count was determined through cell counts and viability was assessed with methylene blue (1 drop of 1% w/w methylene blue to a 5 ml yeast suspension).

Results and Discussion

The following table shows fermentation conditions and statistics that were collected for all 4 fermentations.

Tag A B C D  
yeast prop airlock foil air injected no cover  
initial extract 25 Plato
temperature 20 C
fermentation time 15 days
initial pitch rate 42 49 65 47 B/L
highest fermentation speed* 3.9 6.4 4.5 3.9 Plato/day
final pH 4.76 4.76 4.67 4.67  
final extract 5 4.9 5.1 5.4 Plato
ADF 80.0% 80.4% 79.6% 78.4%  
specific growth 0.19 0.29 0.11 0.14 B/g
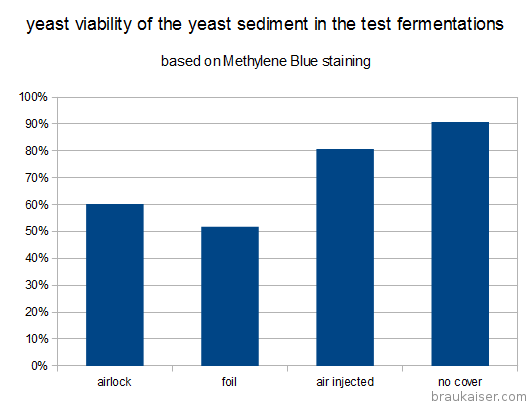
final viability (Metylene Blue) 60% 52% 81% 91%  

*fermentation speed was determined from the highest rate of weight loss.

Due to the inconsistent yeast slurry densities initial pitch rate was not sufficiently controlled by pitching measured amounts of yeast slurry. This resulted in pitching rates ranging from 42 through 65 Billion per liter. But these different pitching rates do not show a correlation to either the fermentation speed,  final attenuation or yeast growth.

The attenuation limit of the wort was not assessed but the resulting attenuation levels are fairly close to each other and other experiments with this dried malt extract suggest an attenuation limit of around 80% ADF. Since all yeasts got close to this attenuation limit subsequent experiments should increase the initial extract to 30 Plato to increase yeast stress factors during fermentation. This will make the achieved attenuation level a better indication of the yeast’s ability to cope with these stress factors.

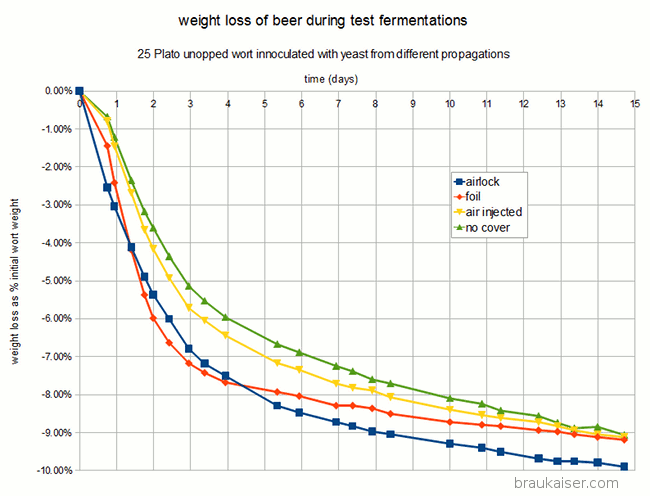
It was expected that the yeast that had the most access to oxygen during propagation, which was C, would show the best fermentation performance. That could not be observed in this experiment. In fact, yeast grown with less access to air (airlock and foil covered), showed better attenuation and fermentation speed.

The fermentation performance was assessed indirectly through a measurement of escaped CO2 based on the loss of weight during fermentation.  Given the rather large outlier for A (air lock covered yeast propagation), which finished with about 1% less weight than the other fermentations while the actual attenuation were fairly similar between all fermentations, these results need to be treated with caution.  If this holds true in subsequent experiments it would be an indication that less aerobically grown yeast (less O2) is better prepared for fermentation and thus does a better job initially than yeast grown more aerobically.

CO2 escape during fermentation plotted as % initial weight loss over time. Fermentation was done in loosely lidded Mason Jars which may have allowed for uneven gas exchange. All 4 samples finished at roughly the same final extract level and larger overall weight loss of “airlock” should be seen as an outlier. Experiments need to be repeated in airlocked fermentation vessels. Note that the labels refer to how the yeast was propagated and not how the test fermentations were conducted.

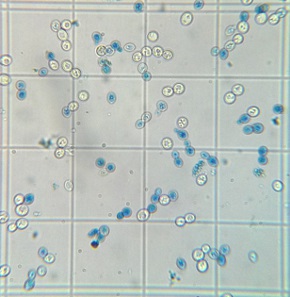
A stark difference was notable in the viabilities of the yeast sediment. Yeast grown with more access to air (air injected and open) showed significantly more viable cells after 15 days of fermentation and a final alcohol concentration of about 10.5% v/v. This suggests that those yeasts may do better during the late phase of fermentation and that they could have outperformed the differently propagated yeasts  in higher original gravity worts. The most straightforward explanation of the better health is that those yeasts had larger sterol reserves which they shared with their offsprings and which better protected them from the toxic alcohol environment. Methylene Blue is known to overestimate viability and these experiments should be redone with a stain that is known to be more reliable (Trypan Blue) or plate counts.

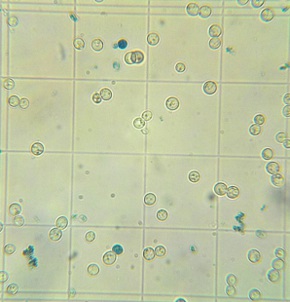
Final cell culture of wort fermented with yeast propagated in a foil covered flask. Stained with Methylene Blue. Stained blue cells are presumed to be dead cells.

Final cell culture of wort fermented with yeast propagated in a flask open to the air. Stained with Methylene Blue. Stained blue cells are presumed to be dead cells.


Tested viability (Methylene Blue) of the yeast sediment after 15 days fermentation of a 25 Plato unhopped wort. The labels refer to the access to air that the pitched yeast had during propagation.

Conclusion

While this experiment was intended to show fermentation performance differences for yeast grown under different propagation conditions it fell short to do so. A repeat of the experiment is needed for more conclusive data. Despite its shortcomings this experiment resulted in data that yeast grown with more access to air is better able to withstand high alcohol environments than yeast grown with limited air access if the initial population size is about the same.

The results also suggest that yeast grown with less air access, presumably less aerobic growth, ferments faster and may lead to better attenuation. More experimentation is needed to confirm this effect.


Stir speed and yeast growth

I’m starting to hit a stride with respect to yeast growth experiments. Last week I posted data on Access to Air and its Effect on Yeast Growth in Starters, this week I have data on the effect of the stir speed.

Some home brewers believe that as long as the starter is moving there is sufficient opportunity for the head space oxygen to diffuse into the starter beer and become available to the yeast as a nutrient. I never really believed that. Last week’s experiment showed that yeast growth does benefit from increased access to oxygen. So, if yeast growth is a reflection of the amount of oxygen taken up by the starter, then the impact of stir speed on oxygen uptake can be shown by its effect on yeast growth.

The setup of the experiment was simple. About 1200 ml of 8.8 Plato wort were prepared from DME and water. There is nothing magical about 8.8 Plato. That’s just how it came out after evaporation and topping off more water than planned. That wort was inoculated with WY2042, the low flocculant lager yeast that has become my favorite lab rat, to an initial density of 0.11 B/g or 10 B/L. That’s a pretty low initial cell density but I wanted the cell growth to be dominated by the available nutrients and not the health or reserves of the initial yeast population. The yeast was about 2 days old. That means 2 days after having been propagated last.

The inoculated wort was distributed among four 500 ml Erlenmeyer flasks. Not all flasks received the same amount of wort since I wanted to prevent the slow speed one from developing a vortex.  After that the flasks were placed on identical PWM (pulse width modulation) controlled identical stir plates at about 22 C. The stir speed was adjusted to:

  • low: no vortex, but yeast is kept in suspension
  • medium: vortex reaches all the way to the stir bar
  • high: strong vortex and lots of air bubbles are visible in the starter

I also added one experiment where I added one drop of Fermcap S to suppress foam formation. But the stir speed was so high that there was still foam formation even with the Fermcap S. This was also done on a high speed setting. No information about the actual RPMs of the speed settings is available.

All four starters were done uncovered in order to eliminate differences in gas exchange that may have resulted from crimping the aluminum foil differently.

The following are images that illustrate how the starters looked at the beginning:


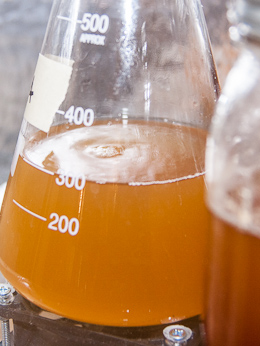
Slow speed setting. A mere dimple was noticeable on the surface of the starter. Total wort weight was 318 g.

Slow speed setting. A mere dimple was noticeable on the surface of the starter. Total wort weight was 318 g.

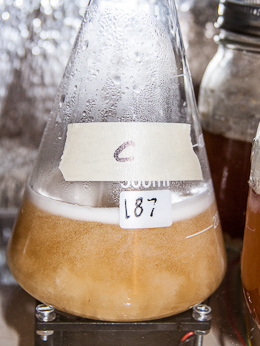
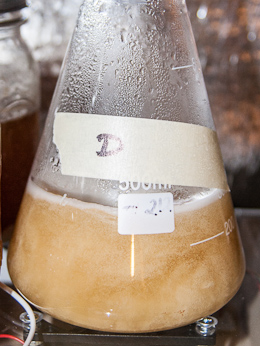
Medium speed setting. A vortex was drawn all the way to the stir bar and created some foaming. Initial wort weight was 296 g.

Medium speed setting. A vortex was drawn all the way to the stir bar and created some foaming. Initial wort weight was 296 g.

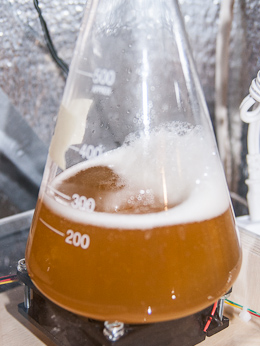
Fast stir speed: bubbles were constantly drawn into the starter giving it a milky appearance.  Initial wort weight: 256 g

Fast stir speed: bubbles were constantly drawn into the starter giving it a milky appearance. Initial wort weight: 256 g

growth_over_stir_speed_2

Fast stir speed + Fermcap S. Same appearance as the “fast stir speed experiment”. Initial wort weight: 263 g

Results and Discussion

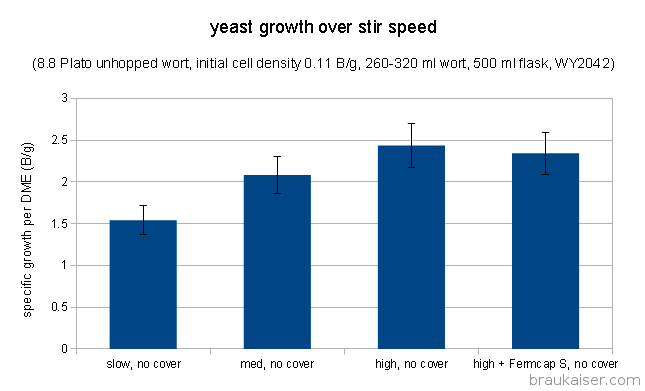
This experiment did show a strong correlation between stir speed and yeast growth. The slower the stir speed was the less yeast was grown per initial gram of extract.

growth_over_stir_speed

This is not surprising given the fact that a well developed vortex allows for a better gas exchange between head space and the starter.  The growth rate of 2.08 B/g for the medium stir speed is in line with the growth rate of 2.25 B/g that the same starter set-up achieved in the Access to Air and its Effect on Yeast Growth in Starters experiment. The measured growth rate for the starter with Fermcap S was slightly lower but should be seen as equal to the other high stir speed starter due to the uncertainty in cell counting.

Conclusion

Stir plate stir speed and resulting vortex development does have an impact on yeast growth. The obvious conclusion is that one should choose a larger flask if that leads to a better vortex. Given that yeast growth depends on the amount of available extract an interesting trade-off becomes apparent: Is it better to have a smaller volume of higher gravity starter with a good vortex or a larger volume of lower gravity starter with a lesser vortex. I’ll be investigating this trade-off soon.

Opinion

I’m not a fan of foam control agents like Fermcap S in brewing. While it can be argued that it is safe (although the manufacturer recommends removal through filtration) it represents a shortcut that home brewers should not embrace. Especially the ones that are complaining about the shortcuts that large commercial brewers are taking. I’m including it in my research in simply because I want to see if the foam produced by a starter gets in the way of the yeast’s access to oxygen.  In this case it did not make a difference which was likely due to the fact that the starters did not develop much foam to begin with and the vortex was quite strong.

Access to air and its effect on yeast growth in starters

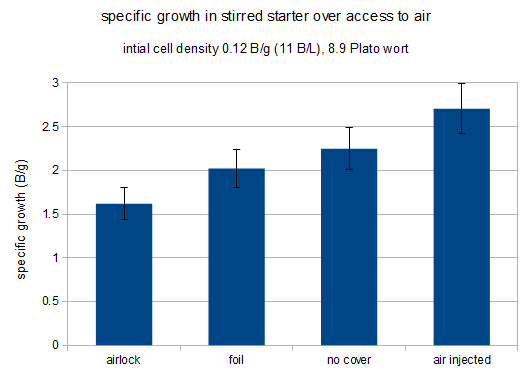
Tonight I was finally able to do cell counts on an experiment that I wanted to do for a while now: “How does the access to air affect yeast growth in starters”. The experiment compared stirred starters capped with airlock, aluminum foil, no cover and injected air.

The setup was very simple. 8.9 Plato wort was prepared using DME and water (no hops) and inoculated with a 2 day old culture of WY2042 (Danish Lager). The innoculation rate was 10.8 B/l or 0.12 B/g (billion cells per gram of extract). The inoculated wort was split between four 500 ml Erlenmeyer flasks. Each flask received about 275 g wort.

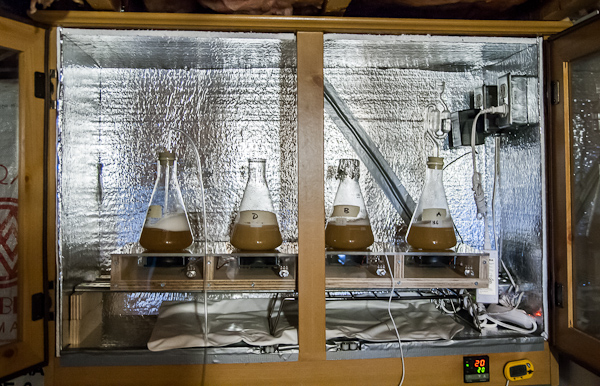
All 4 flasks were placed onto identical stir plates set to identical speed in a temperature controlled incubator. The temperature during the experiment was 22 C.

Setup for the yeast growth over "access tro air" experiment

Setup for the yeast growth over “access tro air” experiment

The air injection was done with sterile air and the end of the glass tube was positioned about 5 mm over the wort surface. This was done to avoid foaming and allowed air to be absorbed through the vortex.

All starters were allowed to grow for 2 days. After that time no more CO2 escape was noticeable in the airlock covered starter.

Results and Discussion

The following chart shows the amount of growth as billion new cells per initial gram of extract that grew in each of the starters. The error bars are based on a counting error of 10% that was applied to both the initial and the final cell count. Given the small number of initial cells the error of the final cell count is dominant in this case.

specific growth for each of the starters

specific growth for each of the starters

It is apparent that increased access to air results in more yeast growth. In a previous experiment (not published) that compared an airlock against a foil coveted stirred starter the air lock covered starter showed a growth of 1.0 B/g for the air lock covered starter and 1.8 B/g for the foil covered starter. That result was more dramatic than the difference shown here.

The stream of air injected into one of the starters was so intense that it actually caused significant evaporation. It lead to a weight loss of 20% compared to the 2.2-3.2% for the other starters. Final cell counts considered the actual final volume.

The increased yeast growth could be caused by 2 different mechanisms.

  1. the more air that is available the more aerobic metabolism the yeast is able to perform. That means more energy for growth since aerobic metabolism is able to generate more ATP per mole of glucose than anaerobic metabolism. But in worts with high levels of sugars, as it is the case here, aerobic metabolism is limited by the Crabtree Effect.
  2. yeast growth in wort is limited by available oxygen for sterol production.  That means that access to more O2 allows more cells to be grown.

This experiment is not able to shed light onto this and more experimentation is needed. Since yeast are able to absorb sterols from the growth medium the addition of olive oil to stirred and airlock covered starters could show if sterol synthesis is a limiter to growth in starters.

Conclusion

The better access a starter has to fresh air the more yeast can be grown. More experimentation is needed to better understand the limiters to yeast growth in starters.

While a completely uncovered flask is not practical for yeast propagation in a brewery it was included to show how how much can can be gained by not restricting the gas exchange. For practical yeast propagation a more sanitary alternative would be necessary.


Estimating yeast growth

Recently there has been a lot of focus on yeast growth calculators for starters. But most of the various calculators out there base their data on work published in Chris White and Jamil’s yeast book. Unfortunately the yeast growth example given in that book was only for a non agitated starter. When a starter is constantly stirred all the yeast is kept in suspension in a homogeneous nutrient environment. That is not true for non agitated starters where yeast will sediment and only evolution of CO2 will cause agitation. As a result stirred and still starters are expected to show different growth behavior that cannot be simply approximated by adding a constant scaling factor to yeast growth.

Jamil’s pitching rate calculator supports stirred starter fermentation but the growth curve used for that mode is a simple scaling of the growth curve for non agitated starters. Jamil never published how he arrived at the model used in his calculator. As a result I have to draw conclusions based on what I can observe when I run data points through his calculator.

Before I get into comparing growth curves, I need to explain how I look at yeast growth. The primary factor in yeast growth is the available sugar. Within a practical range of wort concentrations the actual concentration of wort will have little impact on yeast growth. I’m still going to test this in a controlled experiment but observations from yeast propagation in my brewing seem to support that. Because of that I focus not not how many Million yeast cells are in a ml of wort, but rather how many Billion yeast cells get to share a gram of extract (sugars, proteins, minerals, etc) that is dissolved in that wort.

As for yeast growth, I care about how many new cells of yeast can be grown from that gram of extract. In their yeast book Chris and Jamil use a yield factor defined as new yeast growth in Million/ml per degree Plato drop of apparent extract. This takes into account that different worts can have different attenuation levels and with it varying amounts of fermentable sugars. While this is correct it requires knowledge of the wort’s fermentability and most brewers don’t know the fermentability of their starter wort. Furthermore the uncertainty of starter wort fermentability is likely +/- 5 % and this is well within the imprecision that one can expect from yeast calculators. I expect yeast growth calculators to have an error of +/- 15% or more. Because of that I feel confident in using Billion cells growth per gram of extract (B/g) as the yeast growth metric that should be tracked. Assuming a starter attenuation of 75%, the conversion factor between  “yield factor” and specific growth (B/g) is 13.3:

1 B/g = 13.3 M/(ml*P)

Now that I established how I plot yeast growth I can show some charts.

This one compared Mr Malty data for simple starters and stirred starters with the simple starter data from the Yeast book as well as a 2.7x scaled version of the simple starter data:
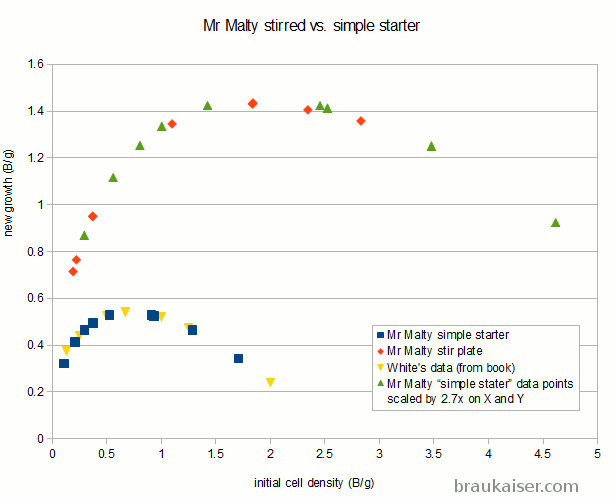
It is apparent that the growth curve for simple starter matches the data from the book, which makes sense. What surprises me, however, is that the stir plate data is not just scaling the yield for a given innoculation rate, but it also scales the inoculation rate. This means that the yeast growth calculator has different optimal innoculation rates for simple and stirred starters. That is something I don’t follow and my data contradicts that. More on that in a moment.

The following is a chart with my data. I have been using WY2042 since it is a low flocculant lager strain. Most of that has been presented in a previous blog post (Yeast growth experiments – some early results). What’s new is the non agitated data points and a few data points for using yeast that was stored in the fridge for 5 days before being used.
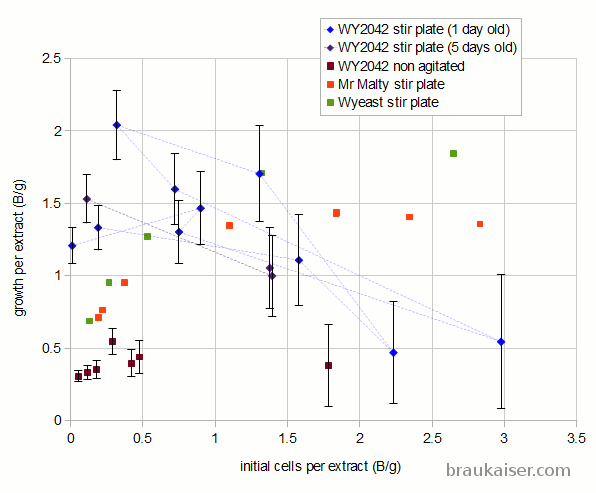
When the data is potted as growth in billion cells per gram over initial billion cells per gram, the data makes more sense. As the amount of extract available to each cell of the starting population approaches the amount of extract needed to grow a new cell, the growth per extract starts to fall. This is because the initial population is in a resting state and when sugar becomes available all vital yeast cells start to consume the sugar. A cell will not start budding unless it consumed all the resources needed to grow a new cell. If this was an ideal culture, where every cell consumes sugar at the same rate and needs the same amount of sugar to grow a daughter cell, cell growth would stop once there are more cells per gram of extract that it takes to grow the same amount of cells. This is because none of the cells would have access to the amount of nutrients needed to grow a new cell. But this is not such an ideal culture and some cells will consume nutrients faster than others and will be able to grow daughters while others can’t.

I also expect that yeast growth of a large population of older cells is reduced compared to young cells since the old cells will need to fill their reserves before they can start accumulating nutrients for growth. I don’t have enough data on that yet to quantify this effect.

This effect of dropping yeast yield is not as pronounced for a non agitated culture. This is because in such a culture not all yeast cells have the same access to wort nutrients due to sedimentation. Yet another reason why one cannot estimate the yeast growth characteristics in a stirred starter from a non agitated starter.

Based on my observations and knowledge of yeast growth so far, I think the following yeast growth model should be used for calculating expected yeast growth in stirred starters:
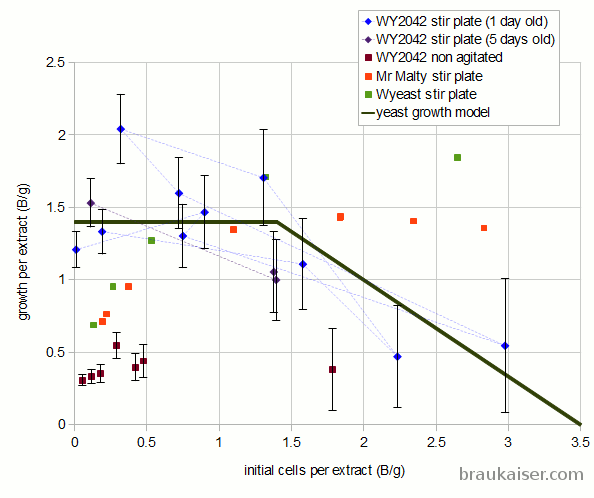
If (initial cells < 1.4 Billion/gram extract)
  yeast growth is 1.4 Billion / gram extract
If (initial cells between 1.4 and 3.5 Billion / gram extract)
  yeast growth is 2.33 - 0.67 * Billion initial cells per gram extract
else
  no yeast growth

For non agitated starters a growth rate of 0.4 Billion per gram should be assumed over the full initial cell density range (0 – 3.5 B/g). I don’t think that starters with more than 3.5 Billion cells/g  are practical. I expect the growth rate in starters to be affected by the shape of the vessel, the volume of the wort and more. The 0.4 Billion new cells per gram proposed here is a rough guess based on the data points I have so far.

Update:

The proposed model for stirred starters has been implemented in: