Mash Titration

Continuing the titration experiments I got a chance to titrate some mash tonight. The titration procedure was the same as described in the previous post and I won’t repeat that here.

But here are the stats for the two mashes that were prepared. One for titration with HCl and the other for titration with NaOH:

  • 100% Maris Otter Pale Malt pulverized with small coffee grinder
  • 3 l/kg mash thicknes
  • distilled water
  • mash temp was ~61 C
  • mash time was 15 min
  • samples were both cooled to 25 C for the titration experiment
  • The results are shown here. This time I followed convention and plotted pH over the amounts of titrant that was added:

    This time the slopes leading up to the normal pH, which was 5.82, are pretty much the same. Based on A.J. deLange’s feedback the large discrepancy between these slopes in the wort titration experiment may have been the result of the fact that the normal pH for malt and wort is at the lower end of the pH where there is a fairly linear relationship between mEq/kg and pH

    I assume a repeat of the wort titration experiment is in order.

    Wort And Beer Titration

    I finally got around to conducting two
    experiments which I wanted to do for a while now: the titration of
    wort and beer.


    Titration is a process in which
    increasing amounts of a strong acid and/or base are added to a sample
    while the pH of the sample is monitored. This gives an indication of
    the pH buffer capacity of the sample at various pH points. It can
    also be plotted as a nice graph, a so called titration curve. More
    about the basics of pH and titration can be found here : An Overview
    of pH
    .


    The set-up of the experiment was as
    simple as this: A diluted solution (~0.64%) of hydrochloric acid was
    prepared by mixing 37% Muriatic Acid with water. I don’t like working
    with the concentrated form of this acid and the amounts of acid
    needed tend to be so small that they would be difficult to measure if
    the undiluted acid is used. In addition to that, a dilute solution
    (1.25%) of sodium hydroxide (NaOH), which is a strong base, was also
    prepared.


    The wort, and later beer, sample was
    weighed and placed into a glass cup along with a stir bar. The pH
    meter probe was affixed to the glass cup using masking tape. (Masking
    tape seems to be a very useful tool in my brewery). While being
    stirred on a stir plate the pH was constantly measured. To determine
    the amount of acid/base that has been added a small cup was filled
    with the acid/base solution and placed onto a digital scale which
    provided a resolution of 0.01 g. The scale was zeroed while the cup,
    titration solution and a pipette was on the scale. By doing so the
    total amount of titration solution removed from the scale would be
    shown as a negative weight.


    The wort sample had an extract content
    of 12.7 Plato.


    The initial pH was measured and
    recorded. After that a small amount of acid was added and once the pH
    reading stabilized this reading and the amount of acid added so far
    was recorded as well. The process was repeated until the sample
    reached a pH of less than 2.0.


    Titration of a fresh sample using a the
    strong base (NaOH) and acid/base titration of a beer sample followed.
    The beer sample had an original gravity of 12.0 Plato and an apparent
    extract of ~3.0 Plato. The beer and wort samples were from different
    batches.


    Using a spread sheet acid and base
    additions were converted to milliequivalents of acid/base per extract
    weight in the case of the wort sample and per original extract weight
    in the case of the beer sample. This was seen as a suitable approach
    since the pH characteristics of the samples are largely determined by
    the dissolved substances.


    Using this data the added amounts of
    acid (negative mEq/kg) or base (positive mEq/kg) were plotted over
    the pH of the samples which resulted in the following chart (click for larger version):

    As expected the wort sample had a
    higher initial pH (5.18) than the beer sample (4.62). But what is
    also apparent is that around that pH the beer sample has a higher
    buffer capacity than the wort sample. Buffer capacity is the amount
    of acid that is needed to change the pH by a given amount. The unit I
    like to use is mEq/(pH*kg) which is milliequivalents of acid/base for
    each pH shift of 1 unit and for each kg of substrate. The latter
    doesn’t count the water. For beer this buffer capacity was 92
    mEq/(pH*kg) when adding the base and 76 mEq/(pH*kg) when adding the
    acid. Ideally they should be the same but measurement errors could
    have lead to this difference.


    In the case of the wort sample,
    however, there was a distinct difference between the buffer capacity
    when adding an acid (29 mEq/(pH*kg)) and when adding a base (64
    mEq/(pH*kg)). I don’t know how to explain this and this is not the
    first time I noticed this discrepancy. It also appeared to me during
    my mash pH experiments. In order to double check my titration
    solutions I calculated how much of the NaoH solution I would have to
    add to a sample of the HCl solution to neutralize all the acid. I
    then performed that experiment and found that the actual amount I had
    to add was within 1.5% of the expected amount. So my titration
    solutions had their expected strength. At least in relation to each
    other.


    The beer sample also shows an area of
    strong buffer capacity around pH 6.5 (where the curve is steepest
    between the two flatter sections). It is possible that this is the
    1st pKa of carbonic acid, which is at pH=6.4, since the
    beer sample was slightly carbonated.


    While the beer and wort samples were
    not from the same batch it is very likely that fermentation creates
    additional pH buffers which are the cause of stronger buffer capacity
    of beer.


    Conclusion


    This experiment does little when it
    comes to finding ways to make better beer, but it gives insight into
    the pH buffer characteristics of both beer and wort. One thing to
    take away is that around the normal pH for wort and beer there is a
    nearly linear relationship between the amounts of acid/base added and
    the pH shift. This means that if the addition of X amount of acid
    drops the pH by Y the addition of 2X acid will also drop the pH by
    2Y. Within the pH range that is practical in brewing there won’t be a
    case where the addition of a little bit more acid causes the pH to
    suddenly “fall off a cliff”.

    Getting back into brewing

    Some of you may have notied that there have’t any updates to the wiki or the blogs here on Braukaiser.com. This is because I had to take a break from home brewing for a while. Although I brewed a few batches in the past to keep me supplied I didn’t even take as many pH readings or determine the pitching rate with the microscope. Yes, other obligations took that much time away from brewing.

    But I’m starting to get back into brewing and the science of it. The first batch of the next side-by-side is fermenting away and I have been updating my blog software. The goal is to finally get the spamming under control so I can enable comments to the blog posts. So stay tuned.

    I also hope go become active on at least the AHA mesage board again. 


    The effect of yeast on the flavor development of Doppelbocks


    Many brewers wonder what difference
    bottle conditioning makes in brewing. One aspect of bottle
    conditioning is the presence of live yeast its effects on the aging
    beer.

    Based on an on-line discussion, which I
    had with fellow brewers, I designed an experiment where I added a
    small amount of live yeast to my Doppelbock when I bottled the
    carbonated beer after cold conditioning.

    The recipe, which I brewed about 7
    month before this sampling, was very similar to the recipe posted on
    braukaiser.com. It was brewed with an enhanced double decoction. The
    first week of primary fermentation was done at 8 C (46 F) and the 2nd
    week was done at 10 C (50 F). This was followed by a 1 month
    maturation at 12-13 C (54-56 F) during which time the beer was racked
    off the primary yeast into a Cornelius keg with shortened dip tube
    where it was allowed to reach its final gravity of 4.8 Plato. To help
    this maturation the beer was kraeusened with WLP830 (German Lager) 2
    weeks into this maturation rest even though the primary fermentation
    itself was done with WLP833 (Ayinger Lager). The attenuation going
    into the following cold conditioning was 73% while the attenuation
    limit of the wort was 76.6%. During the maturation rest the beer also
    built up natural carbonation.

    The beer was cold conditioned for about
    1 month and 2 weeks and then bottled straight from cold conditioning
    at 1 C (34 F) into chilled bottles. The bottles were not purged with
    CO2 prior to filling. Oxygen scavenging caps were used because these
    were the only ones I had at hand. 3 of the bottles received about 300
    Million cells of an active WLP830 (German Lager) culture. This
    yielded about 1 Million cells per ml in these bottles. No sugar or
    other fermentables were added since the beer was already carbonated.

    After bottling the bottles were stored
    in the basement. The ambient temperature started at about 13 C (56 F)
    at bottling time and rose to about 17 C (64 F) over the following 3
    months. 2 days before sampling the bottles were cooled to 10 C (50
    C).

    3 month after bottling and about 7
    month after brewing I sampled a bottle that was bottles without
    additional yeast (non-yeasted sample) and a bottle that was bottled
    with additional yeast (yeasted sample) side-by-side. At the time of
    sampling I knew which was which but didn't know what to expect from
    the yeasted sample.

    Aroma:

    The non-yeasted sample showed the
    typical dark fruit (including black currant) and malt aroma of a
    German Doppelbock with a hint of alcohol while the yeasted sample
    showed a much more restraint aroma. The malt notes and dark fruit
    notes were rather faint. The aroma was more that of the young beer.
    There was also a hint of alcohol in its aroma.

    Appearance:

    Both beers were clear at serving
    temperature. The yeasted sample formed a thin, yet dense, yeast layer
    on the bottom of the bottle.

    Foam stability:

    My standard foam stability test is to
    take a Koelsch glass, pour the beer down the middle to let it foam up
    until the foam reaches the top of the glass. Then the time it takes
    for the foam to collapse and show the beer surface is taken. For both
    samples it took more than 13 min for that to happen.

    Taste:

    The taste experience was similar to the
    aroma experience. The non-yeasted beer showed a much stronger and
    more complex taste while the yeasted sample was more subdued. Both
    samples did not exhibit any off-flavors. In both cases the bitterness
    was low and did not linger into the finish. The non-yeasted sample
    was a bit sweeter which was also reflected in its lower attenuation

    Mouthfeel:

    Both samples exhibited the same
    mouthfeel.

    Stats:

    non yeasted beer

    yeasted beer

    OE

    18.0 Plato

    attenuation limit

    76.6%

    yeast addition

    none (actual residual yeast count was not
    assessed)

    ~ 1 Million/ml

    yeast viability at tasing time (methylene blue
    staining)

    n/a

    ~ 60%

    AE

    4.7 Plato

    4.5 Plato

    attenuation

    74%

    75%

    attenuation delta

    2.6%

    1.6%

    pH (beer)

    4.50

    4.51

    The yeasted beer did ferment a little
    further since at bottling time a small amount of residual fermentable
    sugar was available as can be seen from the attenuation to
    attenuation limit difference of 2.6% for the non-yeasted beer.

    Conclusion:

    The result of this tasting did surprise
    me yet supports my thinking that the hallmark flavor of German Bocks
    and Doppelbocks is in fact the product of oxidation and staling of
    the beer. It is assumed that the yeasted beer sample did not exhibit
    that flavor as strongly since the yeast was able to scavenge the
    oxygen that had been introduced during the bottling process.

    The added yeast did not affect the head
    retention negatively in this case. One way it can do this is by
    releasing excessive amounts of Proteinase A into the beer which can
    break down foam proteins.

    The pH was not negatively affected
    either which is a sign that there was not an excessive amount of
    yeast autolysis or not enough yeast to make a difference.

    The idea that big dark beers benefit
    from small amounts of post fermentation oxygenation has also been
    brought up by fellow home brewer Fred Bonjour and warrants further
    investigation into optimal oxygenation rates ad well as aging times.

    How much effect does a ferulic acid rest have?

    When reading up on brewing Weissbier (also known as Bavarian Wheat) one of the suggestions is a ferulic acid rest. This rest around 43 C
    (110 F) works best at a pH > 5.7 and liberates ferulic acid into the
    wort. This ferulic acid is the precursor to 4-Vinyl-Guajakol which is
    responsible for the the clove flavor produced by Weissbier yeats. The
    more ferulic acid there is in the wort the more 4VG should be produced
    by the yeast and the more clove character the beer should have.

    This
    is what I wanted to test. So I brewed a Weissbier recipe twice. Once
    with a simple Hochkurz mash and another one with an additional 30 min
    43C rest at a pH > 5.70. For the second beer acid malt was added at
    61C. This is above the optimal range for protoelytic activitry since I
    also wanted to limit the protein degradation during the time the mash
    spent in the 45-55C range.

    The following table lists the process steps taken for the 2 beers:


    82

    Weissbier IIIa

    83

    Weissbier IIIb

    water

    70 ppm Ca, 4 ppm Mg, 10 ppm Na, 13 ppm SO4; 30 ppm Cl, 118 ppm
    HCO3,

    RA = 43 ppm CaCO3

    70 ppm Ca, 4 ppm Mg, 13 ppm Na, 13 ppm SO4, 15 ppm Cl, 138 ppm
    HCO3

    grist

    33.5 % Vienna Malt

    64 % Pale Wheat Malt

    1.5 % acid malt

    34 % Vienna Malt

    64% Pale Wheat Malt

    2 % acid malt (added at 61C)

    Mash

    63C for 30 min; pH 5.57

    heating 1 C/min

    71C for 40 min

    heating 1C/min

    75C for 10 min

    43C for 30 min; pH 5.77

    heating at 1 C/min

    63C for 20 min; pH 5.54

    heating 1 C/min

    71C for 40 min

    heating 1C/min

    75C for 10 min

    Hops

    0.52 g/l Hallertauer Tradition 6.8% for 60 min (added before
    start of boil)

    0.52 g/l Hallertauer Tradition 6.8% for 60 min (added before
    start of boil)

    Yeast

    WY 3068; 1000 ml Kraeusen

    WY 3068; 1000 ml Kraeusen

    primary

    7 days at 18.5 C

    6 days; started at 16C and was raised to 20C over the next 3
    days. Fermention seemed done after 3 days. But it was stuck at 5
    Plato.

    Lowered temp to 12C while WLP830 (W34/70) was prepared.

    While at 12C for 10 days the gravity fell from 5.7 to 3.6
    Plato. Beer was racked off old yeast, WLP830 Kraeusen was pitched
    and the beer was bottled at 3.8 Plato.

    Carbonated at 17C for 10 days

    maturation

    5 days at 10 C;

    10 days at 17C for carbonation;

    see primary


    Note that the fermentation for the 2nd
    batch slowed down signficantly after it reached a gravity of 6 Plato.
    At this point I decided to pitch a lager yeast and I cooled the beer
    for the time it took to propagate that yeast. This was to drop out most
    of the original yeat and limit autolysis. This was unplanned and I hope
    it is not the reason why the results of the experiment are like they
    are.


    Tonight I tasted the two beers:


    82

    Weissbier IIIa

    83

    Weissbier IIIb

    age

    7 ½ weeks

    5 weeks

    aroma

    slight clove

    slight banana

    not much difference

    slight clove

    slight banana

    not much difference

    head retention

    fairly stable

    not much difference

    fairly stable

    not much difference

    appearance

    dark golden color

    dark golden color

    taste

    sweet start that finishes with a distinct clove note which
    lends the beer some bitterness

    not much difference between.

    The clove note seems to be at the same level.

    sweet start that finishes with a distinct clove note which
    lends the beer some bitterness. There seems to be a tad more other
    yeast character present

    otherwise not much difference

    The clove note seems to be at the same level.

    mouthfeel

    average mouthfeel

    (compare to standard German Pils)

    average mouthfeel

    (compare to standard German Pils)

    stats

    original extract: 11.75 Plato

    limit of attenuation: 77%

    actual attenuation: 77%

    apparent extract: 2.7 Plato

    pH: 4.25

    original extract:12.7 Plato (I got better efficiency than expected)

    limit of attenuation: 78%

    actual attenuation:78%

    apparent extract: 2.8 Plato

    pH: 4.11


    Conclusion: For the chosen yeast holding the ferulic acid rest
    didn't make any noticeable difference in the clove flavor that was
    produced during fermentation. While additional experiments should be
    made to confirm these findings it is very much possible that this rest
    is not worth the additional work.

    (comments are disabled b/c
    of problems with spammers. Send your questions and comments to kai at
    braukaiser dot com)

    How much effect does repeated foaming have on head retention?


    Many articles about foam stability,
    like this BYO article for example, mention that foaming during beer production can hurt the head
    retention of beer. The explanation is that foaming consumes the
    foaming compounds in the beer. I wanted to see if I can demonstrate
    this with a simple experiment.

    I took two 500 ml PET soda bottles and
    filled each with about 300 ml of 1 C carbonated beer using a beer gun
    like device. The beer was batch A from the Kraeusen Experiment. Both
    bottles where then purged of air by squeezing and closing them once
    all air was squeezed out. To fill the head space with CO2 and provide
    the same storage conditions for both beers both bottles where shaken
    up once. After that they were stored in a 8 C fridge. The control was
    not shaken anymore but the “shaken” beer was shaken 3-4 times a
    day over the next 3 days. Each time the foam was allowed to fall back
    into the beer before it was shaken up again. Including the initial
    shaking, which was also done for the control, the “shaken” beer
    foamed up 10 times. This is 9 more than the control.


    Shortly after shaking up the "shaken" sample.


    On the 4th day, after the
    foam has settled completely I filled the beer into 4 Koelsh glasses
    (2 for the control and 2 for the “shaken” beer) using a funnel
    that was held about 12 inches above the bottom of the glass. Each
    glass was filled until the foam reached the upper rim of the glasses.
    A timer was started when the first glass was filled. “shaken 1”
    was done filling at about 5s, control 1 was done at about 12s,
    control 2 was done at about 20s and “shaken” 2 was done at about
    25s.


    Here are images I took while the foam
    was collapsing.

    Shortly after the glasses were filled. The two glasses on the left are the "shaken" beer and the 2 glasses on the right are the control. The order of filling them was 2, 3, 4, 1 with 1 being the left most sample and 4 the right most.

    2 minutes into the experiment

    After 8 min. All samples appear to have the same amount of head left. The numbers in the lower section of the picture indicate the order in which the glasses were filled. 

     Looking onto the top of the beer. In all samples the surface of the beer starts to show.


     After 9 minutes the foam in all samples receded to a point where beer is visible.


    For both beers it took about 8-9 min
    until some beer showed through the foam when looking into the glass
    from the top. There was no significant difference in foam stability
    between the two beers. The same was true for lacing. While this
    method of evaluating foam stability is not as precise and repeatable
    as the ones performed by beer analysis labs, it is good enough to
    provide an objective assessment of the foam stability of a beer
    using.


    Conclusion

    I'm not saying that foaming does not
    affect foam stability at all but I was not able to demonstrate this
    using this simple experiment. It is possible that other factors play
    a role or that the effect is too small to be detected with such a
    crude approach. But for now, I would not worry about heat retention
    being reduced noticeably when the beer happens to foam during the
    brewing process.

    Should the Kraeusen fall back into the beer?


    Common brewing advice in American home
    brewing is to let the Kraeusen fall back into the beer after primary
    fermentation finishes. Very few brewers question this advice.
    However, all the German books I have read about brewing and some
    American home brewing books state that the bitter gunk on top of the
    Kraeusen should be removed. If it is allowed to fall back in the beer
    it will impart a harsh bitterness. As a result I have always
    fermented in 5 gal carboys and removed the Kraeusen through blow-off.


    In order to find out how much taste
    difference that makes I set out to conduct an experiment. I brewed
    two batches of my Altbier. Both were fermented in buckets. On the
    first batch I allowed the Kraeusen to fall back into the beer. In
    fact I helped it a little towards the end since I needed to rack the
    beer before it was completely fermented. This however should not
    invalidate the results since most brewers leave the beer in their
    carboys well past the end of primary fermentation and until all
    Kraeusen has fallen back. For the second batch I skimmed the brown
    gunk off the Kraeusen regularly.


    Both batches finished fermentation
    during a maturation phase in a corny keg before they were moved to 4
    C to settle the yeast and precipitate haze. Since they were still
    cloudy after 2 weeks I added 3.5 g (½ pack) dissolved gelatin to
    each keg which helped clearing the beer.


    The following table outlines the
    brewing process used for both beers:


    A

    B

    water

    Duesseldorf water profile

    RA = 112 ppm as CaCO3

    grist

    89% Franco Belges Light Munich

    10% Weyermann CaraMunich I

    1 % Weyermann Carafa special III

    water/grist ratio

    4 l/kg

    mash

    63 C – 30 min

    65C – 20 min

    72 C – 40 min

    76 C – 15 min

    63 C – 45 min

    65 C – 25 min

    72 C – 40 min

    76 C – 15 min

    wort fermentability

    (limit of attenuation)

    75%

    76%

    mash pH

    5.25

    (0.18 ml 88% lactic acid per liter strike water was added)

    5.21

    (0.18 ml 88% lactic acid per liter strike water was added)

    hops

    1.9 g/l

    6.8 % Hallertau Hallertauer Tradition

    added 5 min after boil started

    1.88 g/l

    6.8 % Hallertau Hallertauer Tradition

    added 5 min after boil started

    boil time

    60 min

    boil pH

    5.38

    5.3

    cast out wort pH

    5.51 (?) *)

    5.2

    wort chilling

    copper coil immersion chiller to ~30 C

    ice bath to 12 C

    yeast

    WY 1007 grown from slant

    ~2.2 g yeast slurry to each liter of wort

    WY 1007 grown from a small sample of batch A

    ~2.9g yeast slurry to each liter of wort

    Starting extract

    11.2 Plato

    Primary fermentation temperature

    16 C

    Kraeusen removal

    No

    Yes

    Primary fermentation

    length

    10 days

    7 days

    Maturation temperature

    13 C

    Maturation time

    4 days

    6 days

    Cold conditioning time

    4 weeks

    3 weeks

    Fining

    0.2 g/l gelatin

    Final Extract

    2.8 Plato

    Attenuation

    75%

    75%

    Residual fermentable extract

    0%

    1%

    Beer pH

    4.31

    4.18

     *) that pH value doesn't make sense to me. It should not be higher than the pre-boil pH and not that much different from the pH for batch B. But I did take the pH measurement on a sample of wort that had been standing unpitched for 24 hrs as opposed to the batch B post boil pH which had been taken the same day.


    Both batches were fermented in buckets. A clear pot lid kept contamination out and provided easy access to the Kraeusen. The picture shows the batch A. The opening in the blue bucket lid was later enlarged to allow regular Kraeusen skimming for batch B.


    The beer was partially naturally
    carbonated during maturation and then force carbonated during cold
    conditioning. The carbonated beer was bottled straight from the cold
    conditioning kegs.

    I presented the beer as a double blind
    (participants didn't know the difference ) triangle test to 7 club
    members. Only 3 were successfully able to tell the difference. Those
    who were able to separate the beers correctly reported the following:


    A

    B

    – weird aftertaste

    – strong aftertaste

    – “caramelly” aftertaste

    – cleaner after taste

    – cleaner beer

    – preferred by tasters

    I was very surprised how few were able
    to tell a difference which appears so clearly to me. So I poured
    myself 3 triangle tests and have to admit that I only got 2 correct.
    Though I knew what to look for it wasn't as easy to keep the beers
    apart since the lingering bitterness of A seems to stick with one for
    longer enough to affect the taste of the next beer.


    While this was a double blind triangletasting at a club meeting it was fairly unorganized. I didn't not get to start before many of the participants already had other beers. The setting was also not as quiet and free of distractions as one would expect for a taste testing.


    The difficulty to differentiate the
    beers in blind tasting may explain why some brewers, who have tried
    this experiment before, found no difference and thus claim that it
    doesn't matter if the brown Kräusen gunk is removed or not. The type
    of beer may also play a big role. I can imagine that a hop dominated
    highly bitter IPA may not show the difference or may even provide a
    case where the beer, which didn't have the Kraeusen removed, is
    preferred. Having done this experiment and tasted the difference I'm
    convinced that the Kraeusen needs to be skimmed or blown off for any
    German style beer. The type of harsh and lingering bitterness, which
    I experienced in A, is considered a flaw even in the more bitter
    German styles like Northern German Pils and Altbier. The bitterness
    should be clean and linger only little. When it fades in the after
    taste is should never reappear later. The only German beer where I
    had this happen to me was Oettinger Pils which is one of the cheapest
    beers you can by there.


    The results are in line with similar experiment reported in Zymurgy. The article can be
    read at the AHA forum.


    When I sat down for lunch today I had 2
    bottles of this beer and thought I poured the good one. After taking
    the first gulp I noticed that I got the wrong one. To me the taste
    was so bad that I poured it down the drain and poured the other beer
    which I was able to enjoy. I'll likely only finish beer B and pour
    out beer A.


    Conclusion


    Removal of the bitter Kraeusen gunk
    makes a difference in the quality of the beer even though it may not
    be detected by all brewers. The outcome of this experiment is enough
    to suggest that interested brewers try this on their own to see if it
    can improve the quality of their beers.


    updates:

    (1) to make up for my own failure to pass 3 triangle tests with this beer I set up a different taste test tonight. I took 12 identical glasses. 6 were filled with batch A and 6 filled with batch B. I then asked my wife to set up a random line of all 12 glasses. Taking my time and cleansing my palate with bread and water I went though each glass and took one to two sips to determine which beer it was. In the end I was able to separate them precisely based on both their hop taste and lingering bitterness. It shows that if I take my time I'm able to tell them apart reliably. 


    (2) 1 month after the initial taste
    testing I brought samples to a club meeting and was surprised to see
    that the difference, which was very clear to me earlier, has aged
    away to some extend. Knowing what to look for I was still able to
    taste a difference but at this point I would not be surprised if
    others can't tell them apart.


    Differences in Efficiency Calculations

    This is a blog entry I have been thinking about a while. How precise is the ppg (points per pound and gallon) based efficiency calculation really. The reader should see this as something that is interesting to know and more of an exercise in using Plato and sg rather than something that any brewer needs to worry about

    When calcylating efficiency (American) home brewers usually use:

    (1) Eff = 100 * (gravity points of wort * wort volume) / (grain weight * grain extract potential)

    Wort volume is given in gallon, grain weight in pound and extract potential in ppg. But that's not how efficiency is actually defined. It is defined as the ratio between the extract weight in the kettle vs. the extract potential of the grain:

    (2) Eff = 100 * extract weight in kettle / grain extract potential

    The grain extract potential is simple. It is its weight multiplied with the extract content determined in the laboratory mash. For most base malts it is about 77% (80% dry basis extract and 4% moisture content). Going forward I will call the grains extract potential "e". The weight of the extract in the kettle is a bit more complicated. For that we have to look at the Plato scale. Many brewers know degree Plato as another way of expressing wort strength. To be exact: the wort strength in Plato is the ratio between the weight of the extract dissolved in the wort and the the total wort weight:

    (3) P = 100 * extract weight in kettle / wort weight in kettle

    Extract weight in kettle is what we need for (2) but I still need the wort weight weight in the kettle. For that I simply remember that sg (specific gravity) is nothing else than the density of the wort in kg/l. It follows that the wort weight in kg is the product of wort volume in l and its specific gravity:

    (4) extract weight in kettle = sg * wort volume in kettle

    Now I can calculate the actual efficiency by using (2), (3) and (4). First some clean-up and shorter notatons for the variables:

    • Eff_ppg = Efficiency calculated using gravity points and ppg for extract potential
    • Eff_% = Efficiency calculated using Plato and extract % for grain extract potential
    • P = wort strength in Plato
    • sg = wort strength in specific gravity (1.xxxx)
    • GP = wort gravity points ( = (sg – 1)*1000)
    • V_l = wort volume in liter
    • V_gal = wort volume in galon
    • m_kg = grain weight in kg
    • m_lb = grain weight in lb
    • e_% = extract potential of the grain in %
    • e_ppg = extract potential of the grain in ppg

    With that the two efficiencies are:

    (5) E_ppg = 100 * GP * V_gal / (m_lb * e_ppg)

    (6) E_% = 100 * sg * P * V_l / (m_kg * e_%)

    Grain lab analysis results don't show the extract as ppg but as percent of dry weight. To get the ppg equivalent I need to find a formula that calculates e_ppg from e_%. Since it is assumed that both efficicncy calculations (5) and (6) are equal I can set them equal:

    (7) E_ppg = E_%

    Now the busy work. They both use weight and volumes but in different units. That will be fixed by assuming these conversions:

    (8) V_l = V_gal * 3.78
    (9) m_kg = m_lb * 0.45

    For simplicity I'll be using the simplified Plato to sg conversion. I'll later discuss how much that makes a difference.

    (10) P = GP / 4 = (sg – 1) * 250

    After putting all this into (5) and (6) I end up with this huge equation:

    (11) 100 * (sg – 1) * 1000 * V_gal / (m_lb * e_ppg) = 100 * sg * (sg – 1) * 250 * V_gal * 3.78 / (m_lb * 0.45 * e_%)

    Luckily this can be cleaned up considerably. V_gal and m_lb exist on both sides and fall out. So does (sg-1). All the constants can be consolidated into one. What's left is this:

    (12) 0.476 / e_ppg = sg / e_%

    solving this for e_ppg gives:

    (13) e_ppg = 0.476 * e_% / s_g

    This equation means that the extract potential in ppg depends on the grains extract potential in %, which is to be expected, and the specific gravity of the wort for which efficicncy is calculated. This was not expected. Here are a few examples. If sugar, which has an extract potential of 100%, is used to make a 1.040 sg wort it has an extract potetial of ~ 46 ppg. If it was used to make a 1.080 sg wort it has an extract potential of only ~ 44 ppg

    The same is true for a base malt with 80% dry basis extract and 4% moisture. The actual extract content is 76.8%. If used for 1.040 wort its ppg extract potential is ~36.0 ppg. When used for 1.080 wort the extract potential is ~34.6 ppg.

    As a final exercise lets look at a chart that plots the two efficies over the gravity of the wort. The wort volume is held constant while the grain bill is scaled such that the "%" based efficiency remains constant. In addition to that, the sg to Plato conversion is done using the officicial ASBC conversion formula which is a polynominal fit of their sg to Plato tables [deLange]:

    (14) P = -616.868 + 1111.14 * sg – 630.272 * sg^2 + 135.997 * sg^3

    While there are many similar formulas out there, this is the official one given by the ASBC (American Society of Brewing Chemists) and it should be seen as the standard.

    This is the chart I came up with

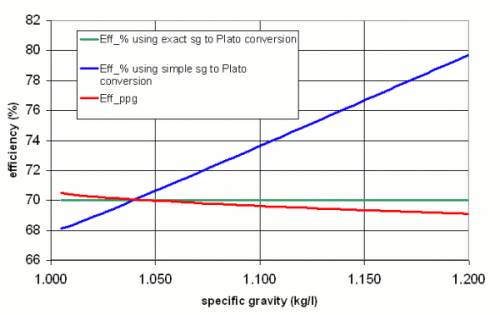
    It plots 3 curves. "Eff_% using the exact sg to Plato conversion" uses (14) to convert between sg and Plato. It is constant at 70% because this formula is used to calculate the necessary grain weight for the given volume and specific gravity. "Eff_% using the simple sg to Plato conversion" uses (10) to calculate the sugar content (Plato) from the specific gravity. "Eff_ppg" calculates the efficiency using gravity points and an extract potential of 35.7 ppg.

    Despite the existing discrepanacy and incorrectness of the ppg based efficiency calculation, which I discussed earlier in this text, it tracks very well with the actual efficiency of 70% over a wide range of specific gravities. The reson for this is simple: while I showed that technically the extract potential in ppg also depends on the specific gravity, I also simplified the sg to Plato conversion by using (10) instead of (14). Both errors compensate each other to some extend. This also becomes clear when looking at the efficiency which is calculated using the simple sg to Plato conversion. It already shows an error of ~4 percent point at a specific gravity of 1.100.

    Conclusions

    Does it really matter in brewing whether you use the ppg based forumla or the Plato based one? Not really. If you always use the same formula for efficiency calculation and subsequent recipe design it doesn't matter at all. It may matter when discussing and comparing efficiency with other brewers. In this case the ppg based approach is within 1% of the actual efficiency for all realistic gravities. That error, however, is too small to be a conern in home brewing. Using the % based efficiency calculation with a crude sg to Plato conversion, on the other hand, can overestimate efficiency significantly. Thus care needs to be taken when converting Plato or Brix readings into specific gravity readings. That is in particular true for high gravity worts.

    One last word about ppg or "points per pound and gallon". It should be called "point gallons per pound" or pgp since it is an expression of how many "point gallons" (gravity points multiplied with gallons) one can get from one pound of grain, sugar, etc. Its actual unit is gal/lb. 

    [deLange] A.J. deLange: Specific Gravity Measurement Methods and Applications in Brewing.


    Undissolved vs. dissolved chalk in the brewing water

    This was the first time that I compared
    dissolved chalk against undissolved chalk in a 5-gal “production”
    batch of beer. Up to this point I have only done small scale
    experiments. Those experiments suggested that chalk dissolved with
    CO2 would be twice as potent in raising the mash pH as undissolved
    chalk is. As a result I new that I should cut the amount of chalk
    needed in half when it will be dissolved with CO2.

    To brew the Schwarzbier I used the
    following grist. This is my standard recipe for a Schwarzbier:

    • 53% Pilsner malt

    • 40% Munich Type II malt

    • 4% CaraMunich III malt

    • 3% Carafa I special

    The water was prepared from reverse
    osmosis water by adding the following salts. Version A uses
    undissolved (i.e. suspended chalk) while version B used dissolved
    chalk

    salt beer A beer B
    Table salt (NaCl) 25 ppm 25 ppm
    Epsom salt (MgSO4*7H2O) 40 ppm 40 ppm
    Magnesium chloride (MgCl2*6H2O) 50 ppm 50 ppm
    Baking soda (NaHCO3) 40 ppm 40 ppm
    Chalk (CaCO3) 200 ppm 100 ppm

    The resulting profile was calculated as
    follows. Note that I do have an old analysis of the reverse osmosis
    water which I included in the calculated mineral profile:

    ion beer A beer B
    calcium 85 ppm *) 45 ppm
    magnesium 11 ppm 11 ppm
    sodium 26 ppm 26 ppm
    sulfate 17 ppm 17 ppm
    chloride 38 ppm 38 ppm
    alkalinity as CaCO3 144 ppm 144 ppm
    residual alkalinity as CaCO3 77 ppm 105 ppm
    residual alkalinity in dH 4.3 5.9

    *) There is some ambiguity as to how
    much calcium is actually contributed by undissololved chalk since it
    contributes only half its alkalinity potential, it may also
    contribute only half its calcium. These results assume that the chalk
    contributed all its calcium. The result is a lower residual
    alkalinity compared to the water with only half the chalk but
    dissolved.

    The salts were then weighed. For beer
    A, they were mixed into the strike and sparge water. Since the chalk
    was not dissolved the water remained cloudy. Water treatment for the
    strike water was done in the mash kettle.

    For beer B the salts were added to 2
    liter soda bottles and reverse osmosis water was added. Then the
    bottles were carbonated with a carbonator cap. Once sufficiently
    carbonated the water cleared overnight which was a sign that the
    chalk got dissolved. This water was then added to the remaining
    reverse osmosis water for mashing and sparging. The mash water was
    prepared the night before to allow residual CO2 to escape. No chalk
    precipitated during that time, There was also no precipitation of
    chalk during the heating of the strike water or the sparge water.

    The resulting pH values during the
    brewing process are shown in the following table. All pH values were
    measured with a sample cooled or heated to 25 C

    process step beer A beer B
    initial mash pH (63 C) 5.6 5.68
    dextrinization rest (72 C) 5.51 5.61
    mash out (76 C) 5.5 5.54
    kettle full (pre-boil) 5.62 5.62
    cast out wort (post boil) 5.66 5.56
    after 7 days of fermentation 4.41 4.45

    For both beers the pH dropped during
    mashing which I contribute to the continued release of acidic
    compounds from the dark specialty malts. One oddity is that for batch
    A, which used undissolved chalk, the kettle full pH is lower than the
    cast out pH. Generally the pH falls during boiling. This is something
    worth paying attention to in future batches although it may also have
    been a measurement error. The initial mash pH of batch B is greater,
    which supports the fact that the residual alkalinity of its water
    should have been higher. This is the case if all the calcium added by
    the chalk is considered for undissolved chalk as it was done in the
    aforementioned water analysis.

    I have not yet done a final tasting
    with these two beers. But preliminary tasting of both batches during
    their fermentation and conditioning did not show any significant
    differences

    Conclusion:

    To achieve roughly the same mash pH,
    only half the chalk is needed when it is dissolved with CO2.

    Decoction vs no decoction on a Dunkel


    After last year's Maibock, this is the
    2nd experiment where I compared a beer brewed with
    decoction mashing and a beer brewed with infusion mashing.


    This time I wanted to see if there is a
    more pronounced flavor difference if the majority of the grist was
    composed of highly kilned base malts. This is one type of grist for
    which decoction mashing is still fairly common in Germany. test test test . So I chose
    a basic Dunkel recipe and the brewing process is outlined after the
    mash diagram for the 2 beers (click the diagram for a larger version).


    Dunkel II

    Dunkel III

    Grist

    99% Best Malz Dark Munich

    1% Weyermann Carafa Special II

    99% Best Malz Dark Munich

    1% Weyermann Carafa Special II

    Mash

    Hochkurz infusion mash

    63C (145F) for 30 min

    hot water infusion

    70C (158F) for 45 min

    thin decoction boiled for 3 min

    75C (167F) for 15 min

    Intensified double decoction:

    35C (95F) for 30 min

    pulled 60% mash as decoction

    slowly heated

    70C (158) for 60 min (it didn't want to get iodine negative)

    slowly heated

    35 min decoction boil

    returned decoction to main mash

    63C (145F) for 40 min

    pulled thin decoction; 5 min boil; returned

    70C for 20 min

    hops

    0.48 g/l Hallertau Magnum (12% a-acid) added before start of
    boil and boiled for 60 min

    0.48 g/l Hallertau Magnum (12% a-acid) added before start of
    boil and boiled for 60 min

    boil

    60 min; 9% boil-off

    60 min; 8% boil-off

    yeast

    WY 2206; raised in 10l 2 Plato wort wit constant aeration

    harvested from Dunkel II

    primary

    pitched at 9C (48F)

    fermented 8 days at 10C (50F)

    pitched at 8.6 (47F)

    fermented 11 days at 10C (50F)

    maturation

    11 days at 15C (59F)

    18 days at 15C (59F)

    cold conditioning

    8 weeks at 1 C (34F)

    4 weeks at 1C (34F)

    aging

    6 weeks at 10 C (50F)

    6 weeks at 10 C (50F)

    stats

    OE: 12.8 Plato

    attenuation limit: 71%

    attenuation: 67%

    attenuation delta: 4%

    AE: 4.2 Plato

    pH: 4.25

    OE: 12.0 Plato

    attenuation limit: 76%

    attenuation: 69%

    attenuation delta: 7%

    AE: 3.7 Plato

    pH: 4.28

    It should be noted that the Dark Munich
    malt caught me by surprise and the mash for Dunkel II resulted in a
    rather unfermentable wort (attenuation limit 71%) which was
    compensated for during the mash of Dunkel III (see longer maltose
    rest). As a result the wort for Dunkel III was more fermentable. But
    both beers finished with a similar attenuation (67% and 69%). The
    poor fermentability was attibuted to the enzymatic weakness of the
    Best Malz Dark Munich which took a long time to convert (see the 40
    min 70C rest of the decoction) and showed similar attenuation
    problems in subsequent beers.

    3 ½ months after brewing Dunkel
    II and 3 months after brewing Dunkel III I tasted the beers
    side-by-side. It should be noted that at the time of this tasting I
    was not aware that I brewed one with decoction and the other one
    without. I had brewed quite a number of other beers in between and
    actually forgot how I mashed these beers and thought that they were
    both brewed with decoction until I checked my notes.

    Dunkel II (left) and Dunkel III (right) 


    Dunkel II

    Dunkel III

    aroma

    – sweet Munich malt character

    – hint of roast present

    – but not as strong as Paulaner Dunkel

    – same as Dunkel II

    appearance

    – dark mahogany color

    – tan head

    – slightly more hazy than Dunkel III

    – slightly more head retention than Dunkel III

    – same as Dunkel II

    – except less haze and slightly less head retention

    taste

    – malty sweet start

    – finishes with dark malt character and a hint of roast

    – slightly less sweet than Dunkel II in its start

    – the finish is slightly less malty

    – hit of roast present

    mouthfeel

    – fuller than Dunkel III

    – slightly less full than Dunkel II


    As you can see I did notice differences
    berween the beers but it is difficult to tie them to the decoction
    alone. I contribute the better clarity, lower head retention and
    thinner mouthfeel of the more intensely mashed Dunkel III to the
    stronger protoelytic activity in the mash. Its increased sweetness
    stems from the larger amount of residual fermentable sugars (see
    attenuation delta) compared to Dunkel II. I even considered Dunkel II
    (the non-decocted, more precisely only 3 min thin decoction boil) to
    be the more malty of the two beers.


    Conclusion: This experiment was
    not as conclusive as the Maibock experiment and I would even call it
    inconclusive. There were too many differences between the analytic
    parameters (in particular the attenuation numbers) of the two beers
    to tie their slight taste differences to the more intensive mashing
    (including a 35 min decoction boil) of the Dunkel III. A future
    experiment needs to increase the decoction boil time to 60 min and
    attempt to keep the original extract, attenuation limit and
    attenuation and fermentation the same.


    (Comments have been disabled due to
    spam being posted. Please send comments and questions to kai at
    braukaiser dot com)