Conversion progress in a single infusion mash

This was my contribution to the most recent Basic Brewing Radio / BYO listener experiment. It was also the first time that I was able to contribute.

When brewing my most recent KaIPA, I took iodine tests and mash gravity readings during the mashing process. The grist consisted of

  • 90% Bairds Pale Malt
  • 4% Weyermann CaraMunich I
  • 6% Weyermann Munich II

Mash temperature was 68 C at a mash thickness of 3.5 l/kg and a mash pH of 5.45. The mash was stirred before a sample was taken.

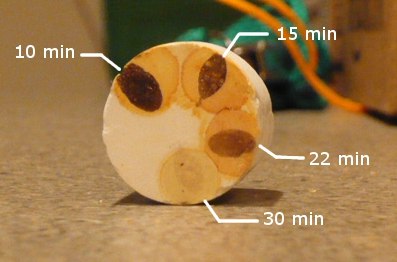
This is the progression of the iodine test:

At the 30 min mark I considered the iodine test negative.

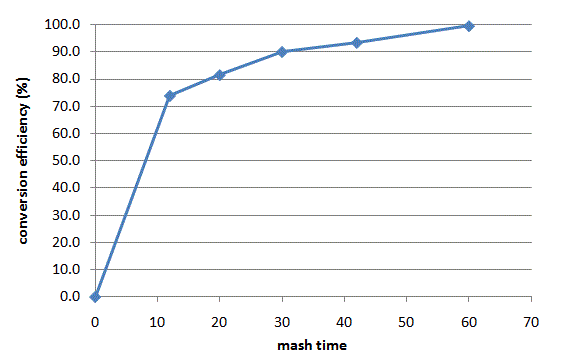
The progression of conversion efficiency looked like this:

After 30 min, when the iodine test was negative, only 90% of the extract potential of the grain had been released into the mash’s sweet wort. If I would have run-off at that point efficiency into the kettle would have suffered about 8-9% (conversion efficiency needs to multiplied with the lauter efficiency if efficiency into the kettle is needed). Mashing another 30 min gave me the additional 10% extract potential from the grain.

To what extent the attenuation was still changing after 30 min I don’t know. But I assume that there wasn’t much change happening due to the relatively high mash temp which denatures the beta-amylase more quickly.

Basic Brewing Radio on mash conversion and iodine test

I had the honor to join James, Chris Colby and Zot O’Conner in a Basic Brewing Radio show that discussed the results of a listener experiment on mash conversion time.

Triggered by Chris Colby’s comment that mashes convert in as little as 10-15 a listener experiment was conducted for which listeners had to record the progression of the iodine test and, if possible, the sweet wort extract content in the mash.

The result is what I have been observing on my own batches and in experiments: a negative iodine test (no starch or large dextrins present) is not necessarily an indication that the mash is done. Even after a negative iodine test the extract content in the sweet wort keeps increasing which is an indication that there is continued release of sugars and dextrins into the wort. If the wort would be lautered too early the efficiency into the kettle might suffer.

The experiment was also a good insight into how different brewers conduct the iodine test. Most are using the iodine solution in undiluted form which makes it difficult to tell if the color is coming from a reaction with starch or large dextrins or is coming from the iodine itself. I recommend diluting the iodine solution with rubbing alcohol (1 part iodine solution like iodophor, Lugol’s iodine or providone iodine and 9 parts rubbing alcohol).

Basic Brewing Radio: March 3, 2011 – BYO-BBR Conversion Experiment (iTunes|Streaming mp3)

About pH Targets and Temperature

I noticed that the topic “At what temperature should mash pH be measured” comes up once in a while.  Just recently I had an e-mail and an on-line discussion with a fellow home brewers on the same subject.

Fact is that the pH of a solution changes with temperature. It is caused by a change of the dissociation constants of the various acids/bases that are in the solution. Even water is considered an acid since it can donate hydrogen ions, although in most cases it is not dominating pH at all. The extent of the change depends on the substance. By the same mechanism even the pH optimum of enzymes may shift with temperature it is also dependent on the ionization state of the acids in the protein. I believe that the 0.35 correction factor for mash temp (65 C) vs. room temp (25 C) pH contains both the aspect that the actual pH in the mash is lower at 65 C compared to 25 C and that the pH optimum of the amylase enzymes shifts a bit from the value that can be observed by room temperature mashing.

But none of this matters since by convention pH values in brewing are reported as the pH of a room temperature sample. This arises from the laboratory practice of cooling pH samples before pH is tested. While pH meters can correct for temperature and their probes may be able to withstand higher sample temperatures, testing only cooled sample extends the life of the probe. This common practice also means that reported pH optima and pH ranges are for room temperature samples even though the actual reaction happens at higher temperatures. A.J. deLange mentioned to me the “by convention” aspect which is an important argument in this discussion. “By convention” means that we could do it differently but we settled on this particular method in order to communicate our observations and recommendations more clearly.  Just as an example, another brewing measurement where we have a convention is the expressing the extract content in specific gravity. Rather than Plato, which measures the extract content by weight and which is something that doesn’t change with temperature, specific gravity does change with temperature and we assume that all those measurements are corrected for temperature such that they apply to a 68 F sample. The practice is and should be done for pH measurements. To be exact you’ll have to cool hot samples and warm cold (e.g. beer) samples.

It’s also helpful to take into account how we arrived at these pH optima/ranges. They are determined by conducting a series of mashes (at correct mash temp for that enzyme) with differing pH. The pH is tested in a room temp sample. The amount of product produced during these reactions (sugar, for example) is then plotted over this room temperature pH.

The same is true with boil pH recommendations where kettle boils at different pH values were done to determine how wort quality changes when the boil pH changes.

One problem is that hardly any author is explicit about this. I assume that most of them see it as a given that they talk about pH from room temperature samples. Briggs was the only one I found that made a distinction. This lack of explicitness, if this is a word, seems to cause a lot of confusion with home brewers.

As for the origin of this confusion, I believe that early home brewing literature and publications are to blame. John Palmer’s 1st edition of “How to Brew” states this:
“When you mash 100% base malt grist with distilled water, you will usually get a mash pH between 5.7-5.8. (Remember, the target is 5.1-5.5 pH.)”

In this sentence he mixes room temp and mash temp pH values. The 5.7-5.8 base malt pH is correct when seen as the pH of a room temperature mash sample while the 5.1-5.5 pH target is only correct when seen as a mash temp pH target with a conversion factor of 0.35. With the correction the room temp sample pH target range is 5.45 – 5.85, which is more correct.

The pH optima that John cites for various enzymes seem to be mash temp pH values. He doesn’t quote a source but the only source that I found which lists mash temp pH values is Briggs’s Brewing Practice and Science book. In this he also gives room temp pH numbers.

I came across this inconsistency when I started reading more technical brewing literature. The pH optima listed for the enzymes for the given optimal mash pH ranges just didn’t line up with what I heard from other brewers. It took me a while and doing my own pH vs. conversion experiments to get a clearer picture of this topic.

And to answer the question that is most interesting to brewers, I believe that the optimal mash pH range is 5.3-5.5 for light beers and 5.4-5.6 for darker beers when testing a room temperature sample of the mash. This pH range is a good compromise between optimal enzyme activity, good boil pH and good cast-out wort pH.
I think we figured out what’s the problem with chalk

Ever since I discovered that chalk, when simply added to water or mash, does not raise the pH as much as an equal amount will do when it is dissolved with CO2 (see these old bog posts: How much alkalinity does 1 ppm of CaCO3 (Chalk) really add? and Undissolved vs. dissolved chalk in the brewing water) I was wondering why.

Recently the discussion got some traction again and got more of A.J. deLange’s attention than before. He proposed that chalk dissolves only slowly at mash pH. Slow enough that the time it takes us to mash doesn’t dissolve all the chalk. In hindsight this looks like a logical explanation. It also breaks with the common (home) brewing wisdom that chalk added to water or mash will dissolve since the mash pH is low enough. And then there has been this “bug” in John Palmer’s water calculator which for a while has been seen as the only reference for mash pH calculations. His water spreadsheet assumes that chalk adds only half its alkalinity potential to the mash. While it may not have been intended it ended up being a close enough approximation of chalk’s behavior in the mash.

A few days ago I did a simple experiment. I rinsed another 500 ml of 7 Plato wort from the spent grain of a batch of IPA I was brewing. To 250 ml I added ~110 mg chalk and to the other I added ~130 mg baking soda. Based on mash titration experiments these salt additions should have been capable to raise the pH by more than 1. I was not really looking for quantitative results but for a qualitative measurement of the pH behavior when chalk or baking soda are added to wort.

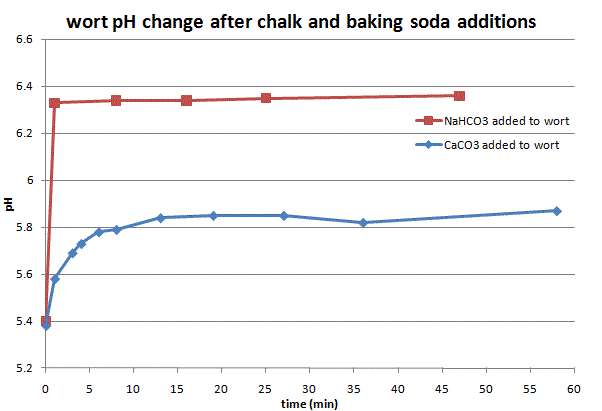
After the salts were added I kept stirring and recorded the measured pH values over time. The resulting graph is shown below.

It is apparent that the pH change caused by baking soda is sudden and remains fairly constant over time while chalk causes a sudden initial rise and a further gradual rise that continues over 15-20 min. Even though the 110 mg chalk added about 1.57 mEq residual alkalinity and the 140 mg baking soda added about the same amount (1.55 mEq), baking soda caused 2x the pH change. This lines up with previous observations I made regarding undissolved chalk.

If chalk does not completely dissolve we also need to assume that it releases only part of its calcium to the mash. This has been corrected in the current version of my Kaiser_water_calculator.xls which assumes that undissolved chalk contributes only half its calcium and half its alkalinity.

New article about mash pH contol

I finally completed a new article that took almost a year to write. It took so long not only because I took a break from brewing and writing about it for a while, but most importantly I wanted to write an article that is well supported by brewing experiments and close observations of mash pH in batches of beer that I brewed over the last year. All too often get brewers caught up in the theoretical aspect of water and mash chemistry with the aim to calculate everything with the best precision possible. But what is commonly overlooked is that measurements are not precise enough to require this precision and, what is mots important, malt’s reaction to pH changes is not that predictable anyway. To capture that aspect experiments are necessary.

The objective of this article was to give the advanced brewer an insight in the major factors that affect mash pH and how it can be corrected. Based on experiments it also gives guidelines that allow the estimation of mash pH changes based on the water profile, water treatment additions or mash additions, without focusing too much on this aspect. Those are largely based on mash pH experiments I conducted including the data published in The effect of brewing water and grist composition on the pH of the mash.

With this article I also released a updated version of my water calculator. But more on this later.

Click here: Mash pH control

Kai

Calcium and Magnesium’s effect on mash pH

I have evaluated the effect of calcium and magnesium on the mash pH before when I investigated the pH effects of various waters (The effect of brewing water and grist composition on the pH of the mash). This time I repeated these experiments but didn’t add the calcium and magnesium salts before dough-in but after dough-in. I was wondering if there is a difference or if I could repeat my observations.

The experiment set-up was fairly simple. 7 glasses were filled with 160 ml distilled water and heated in a ~75C water bath. 7 40 g samples of Rahr 2-row were weighed and milled separately with a ~0.75 mm mill gap resulting in a mash thickness of 4 l/kg. Strong calcium chloride and Magnesium sulfate solutions were prepared. The mash samples were doughed-in 3 min apart from each other. Each of the mashes had an initial mash pH of 63-64 C. 5 min after dough in different amounts of either the calcium brine or the magnesium brine were added. One mash remained unchanged. 15 min after the salt addition a sample of the mash was removed, cooled and its pH was recorded. Another sample was taken 60 min after the salt addition.

The results, along with data from previous mash experiments, are plotted in the chart below:

The first observation is that the distilled water pH for the Rahr 2-row is surprisingly low for a pale malt. I also observed this when I used this malt before. The earlieexperiment used pilsner malt which had a more typical distilled water mash pH of 5.7 and 5.8 respectively. Another observation is that magnesium is less effective than calcium in lowering the mash pH. A fact that is already known from the residual alkalinity equation where magnesium hardness is seen as half as effective in neutralizing alkalinity compared to calcium hardness.

As the calcium content increases the achieved pH drop gets smaller which suggests that the curve is approaching a saturation. However, this matters little to practical brewing since the amounts of calcium needed to drop the pH that low by far exceed the recommended amounts. At 42 mEq/kg, for example, the calcium content of the water in a 4 l/kg mash is already 212 mg/l. 50-150 mg/l is the recommended range for brewing water. In case of magnesium 40 mEq/kg mean ~110 mg/l magnesium in the mash water. This is way more than the magnesium levels commonly found in brewing water. Since magnesium is not as effective as calcium anyway it would not be a good choice for lowering the mash pH anyway. If the salts are only added to the mash water, their “flavor active” concentration can be spread over the total water volume used to brew that beer which will reduce the overall impact.

To put this in perspective ~2.1 g of gypsum (calcium sulfate) needs to be added for every kg of malt in order to drop the mash pH by 0.1 units. If we assume that for the average 12 Plato beer ~7.5 l water are needed for every kg of malt, this gypsum addition is equivalent to a water calcium increase by 65 mg/l and a sulfate increase of 155 mg/l.

For calcium chloride only 1.8 g are needed. The calcium content gets bumped by 65 mg/l (when spread over all the water even though the calcium is only added to the mash) and the chloride content gets bumped by 115 mg/l.

There is little change in between the 15 min and the 60 min pH measurement.

Moved to new location and blog engine

After struggling with too many spam comments and somewhat limited spam control support from Lifetype I finally made the move to WordPress. Since I moved the old blog posts by importing the RSS feed, the few good comments I had are gone. Sorry about that.

Links to the posts will also appear in a more readable format, which is nice.

WLP-002 English Ale Giant Yeast Colony

Ever wondered what would happen if you let a yeast culture
on agar grow? The result is called giant yeast colonies which in the past have
been used to distinguish yeast strain. Differences in metabolism, flocculation characteristics
and genetic stability lead to differences in the appearance of the giant
colonies.

So I wanted to give it a try myself. Brewing Techniques
featured an article on that topic which pointed out that the growth medium
needs to be much thicker than the thin agar medium that is commonly used for Petri
dishes. Not having deep mycological Petri dishes I used 4 oz canning jars. The
growth medium was regular strength brewing wort solidified with agar. The BT
article suggests using gelatin but that didn’t work for me, likely because I
forgot about the advice not to autoclave the gelatin.

The agar surface was inoculated with very small amount WLP
002 (English Ale) yeast and allowed to grow for a few weeks at about 15-20 C (60-68
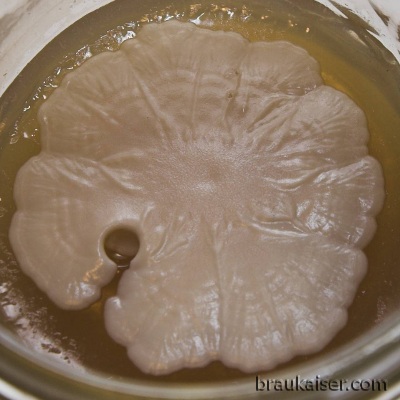
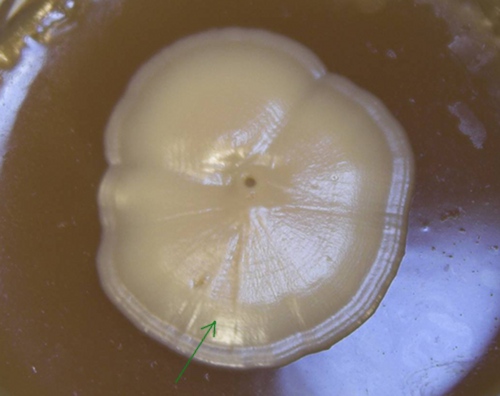
F). The result is shown below.

Apparent are “growth rings” which are considered typical for
highly flocculent yeast. Another interesting feature is the wedge shaped change
in yeast appearance (green arrow). This is likely caused by a mutation that happened to a
cell at the tip of the wedge which caused it and the cells originating from it
to grow differently than the other cells in the colony.

While growing giant yeast cells has little application in practical
brewing it is one of those fun things that can be done with supplies that I have
in the brewery anyway and I also plan to gow and document the giant colonies of
other strains in my yeast collection.


Wort aeration with a perforated pipe

On my last batch I put my dissolved oxygen meter to good use and tested the effectiveness of an wort aeration device that some brewers use. This device is a pipe with several small holes. As the wort flows through the pipe it pulls in air through the holes (Venturi Effect). The air then mixes with the wort and oxygenates that wort.

Building this device is simple. I used a 12 inch copper pipe in which I drilled 20 small holes. The holes are clustered around the top. The pipe was sanitized in boiling water and attached to the end of the vinyl tubing used for racking the wort from the boil kettle to the carboy.

The extract content of the wort was 11.0 Plato, its temperature 15 C and its volume 16 l.

I noticed that when wort is flowing through the device air is not necessarily drawn in. If this is the case some movement or shaking of the pipe is necessary to start the inflow of air which is accompanied by an audible gurgling. I did not pay attention to that at the beginning and as a result about ¼ of the carboy were filled without the device actually pulling in air.

Another problem was the substantial development of foam which required 2 pauses in order for it to settle so filling could continue.

Once the 5 gallon (18.9 l) carboy was filled to the 16 l mark. I swirled the wort around in order to provide some mixing action.

The resulting aeration in the carboy was about 4.5 ppm which is 3.5 ppm short of the 8 ppm that are recommended for most medium gravity ales and 7.5 ppm short of the 12 ppm that are recommended for lagers.

The problem with this device is that the air bubbles it creates are not small enough for an effective O2 transfer between air and wort. While a lot of foam was created, this foam had much larger bubbles than the fine foam that is created by using a mix-stir or a sintered stone for aeration. Both these methods have shown better performance in wort aeration (not yet published data).

To test this aeration method further, a 1 qt Mason jar was filled with about 1 pint of wort through the perforated pipe. The resulting oxygen content was about 3.5 ppm. Closing the jar and vigorous shaking it for about 30 s boosted the wort oxygen content to 7.3 ppm which is close to oxygen saturation possible with air (about 8.0 ppm).

It should be noted that these are the results of one limited experiment and that they can not necessarily generalized to say that aeration with a perforated pipe always leads to inadequate wort oxygenation.